
Getting Started with Workspace ONE Intelligence
Overview
VMware provides this operational tutorial to help you with your Workspace ONE® environment. In this tutorial, explore the core capabilities of Workspace ONE® Intelligence™. Learn how to enable Workspace ONE Intelligence, use reports and dashboards to get insights and enforce device compliance, and finally create workflows using Freestyle Orchestrator to take actions on devices and enable collaboration across IT.
Additionally, learn how to bring together custom dashboards and automated workflows for patch remediation on Windows devices based on missing Microsoft KBs.
Audience
This operational tutorial is intended for IT professionals and Workspace ONE UEM administrators of existing production environments.
Knowledge of additional technologies such as device management, analytics, APIs, and Workspace ONE® UEM is also helpful.
Getting Started with Workspace ONE Intelligence
Workspace ONE Intelligence is designed to simplify user experience without compromising security. The intelligence service aggregates and correlates data from multiple sources to give complete visibility into the entire environment.
In this exercise, you opt-in to Workspace ONE Intelligence, retrieve the UEM API service key, and integrate Workspace ONE Intelligence Workflow Connectors with Workspace ONE UEM.
Prerequisites
Before you can perform the procedures in this activity, ensure you have the following components installed and configured:
- Workspace ONE UEM supported version – contact your support representative if Workspace ONE Intelligence Reports is not enabled in your environment.
- For Workspace ONE UEM on-premises environments, you must install the Workspace ONE Intelligence Connector. The connector enables the synchronization of UEM data into Intelligence.
- Customer-level Organization Group. You can launch Workspace ONE Intelligence only from a Customer type Organization Group.
- Admin role with Intelligence permissions. For more information, see Admin Roles.
This activity requires certain account credentials. Note the account information in the following table. The details provided in this table are based on a test environment. Your user account details will differ.
| Workspace ONE UEM Credentials |
|
| Base URL | |
| API Username and Password | |
| Console Username and Password | |
Logging in to the Workspace ONE UEM Console
To log in to the Workspace ONE UEM console, perform the following steps:
- Navigate to the environment URL of your Workspace ONE UEM console. For example, https://<tenant>.awmdm.com.
- Enter your username and password for the environment then click Log In.
For more information, see Logging in to the Console.
Accessing Workspace ONE Intelligence
After you have met the requirements, you are ready to enable Workspace ONE Intelligence.
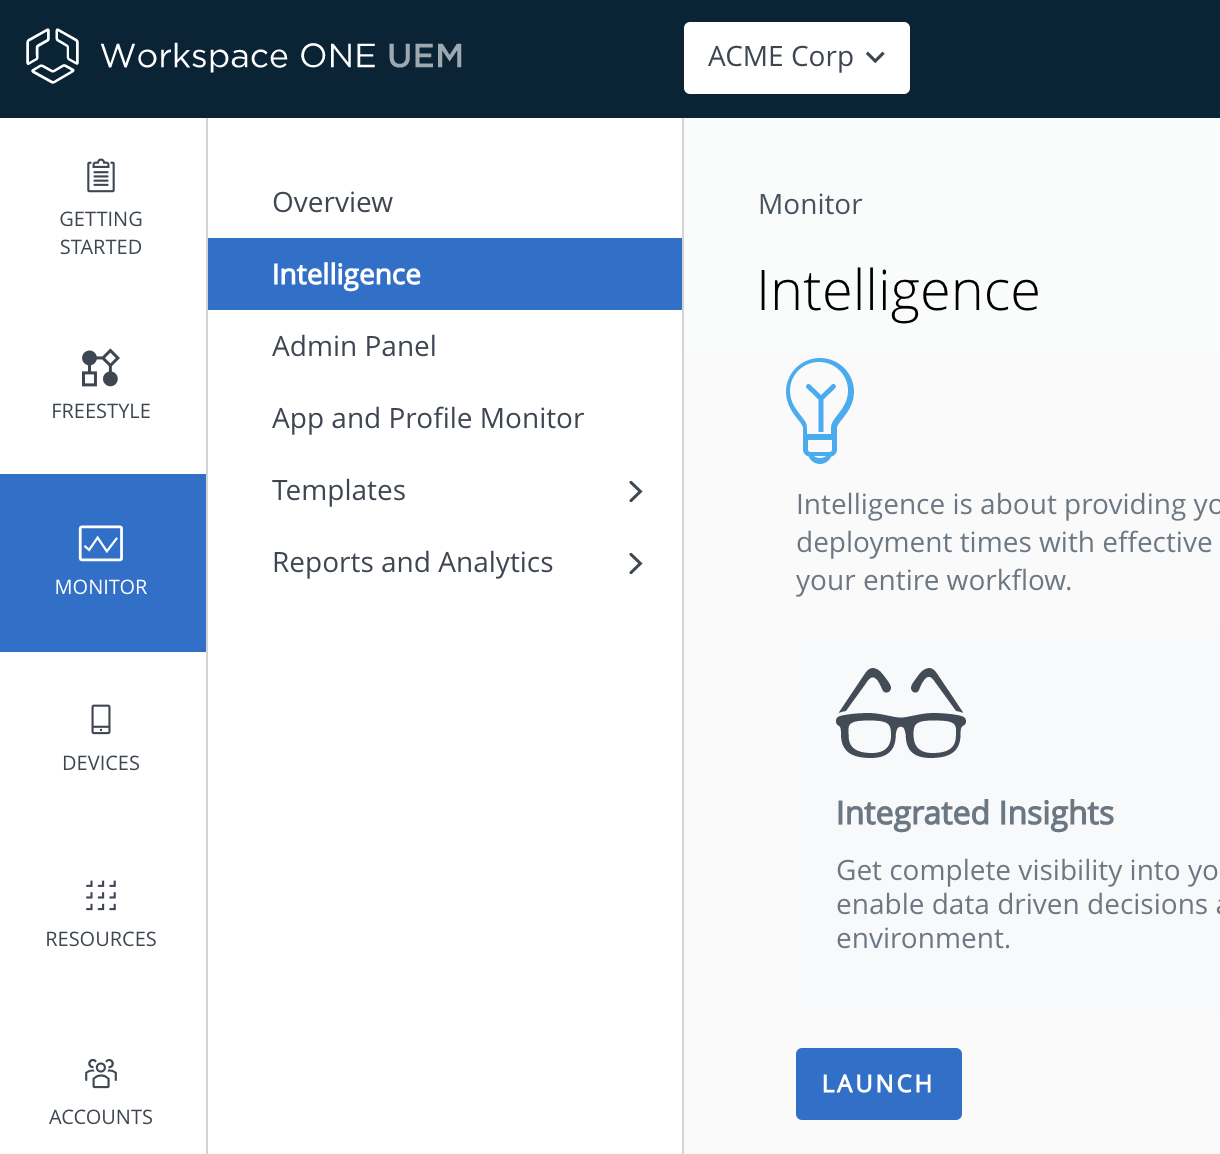
- In the Workspace ONE UEM console, navigate to Monitor > Intelligence.
- Select Opt-in, and select Launch after installing the Workspace ONE Intelligence Connector service.
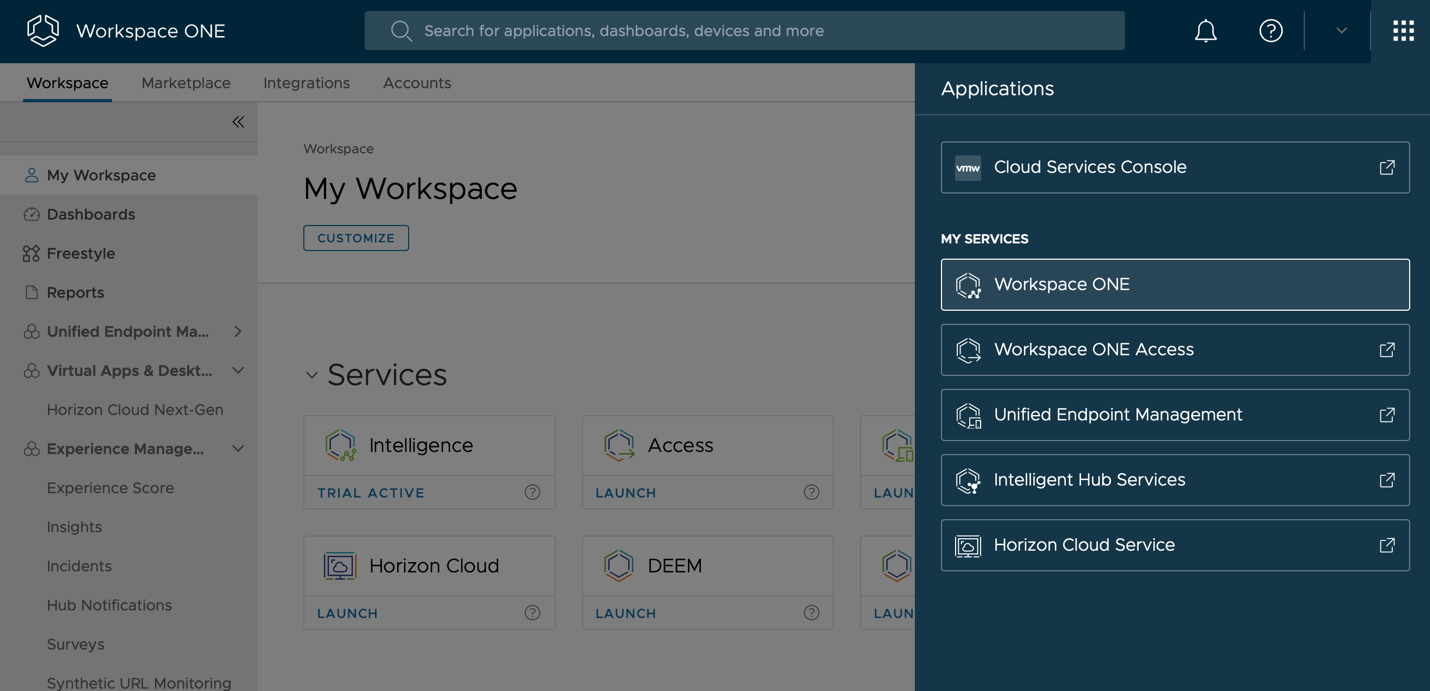
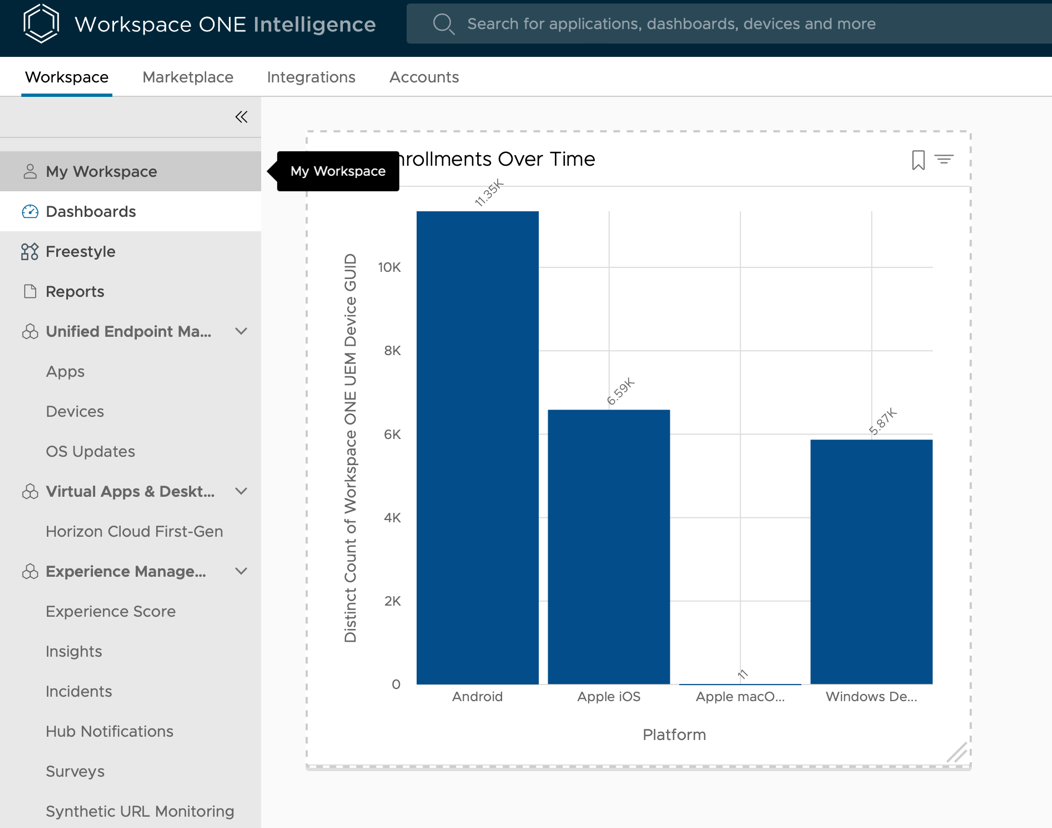
Note: For customers with access to Workspace ONE Cloud, Workspace ONE Intelligence can be launched directly from the My Workspace page.
For more details, see Access Workspace ONE Intelligence.
Logging in to the Workspace ONE Intelligence Console
To perform most of the steps in this tutorial, you must log in to the Workspace ONE Intelligence console. Now that you have opted-in to the service, you can launch the Intelligence console from the Workspace ONE UEM console.
- From the Workspace ONE UEM console, navigate to Monitor > Intelligence and click Launch.
Note: You can launch Workspace ONE Intelligence only from a Customer type Organization Group. If you select a non-customer type Organization Group in the Workspace ONE UEM Console, the Monitor menu option will not be available. - Confirm that the Workspace ONE Intelligence console is open.
Workspace ONE Intelligence can also be launched from Workspace ONE Cloud.
Integrating Workspace ONE Intelligence Workflow Connectors with Workspace ONE UEM
After retrieving the AirWatch API service key, you are ready to integrate Workspace ONE Intelligence Workflow Connectors with Workspace ONE UEM.
To take full advantage of Workspace ONE Intelligence, you need to configure at least one Automation Connector to enable Workflow Actions in your environment.
Among the multiple available Connectors, the Workspace ONE UEM workflow connector is key, as it enables Workflow Automation to take actions against your organization's managed devices, apps, and OS updates.
Follow the steps to set up Workspace ONE UEM as a Workflow Connector which will allow API communication between Workspace ONE Intelligence and Workspace ONE UEM. 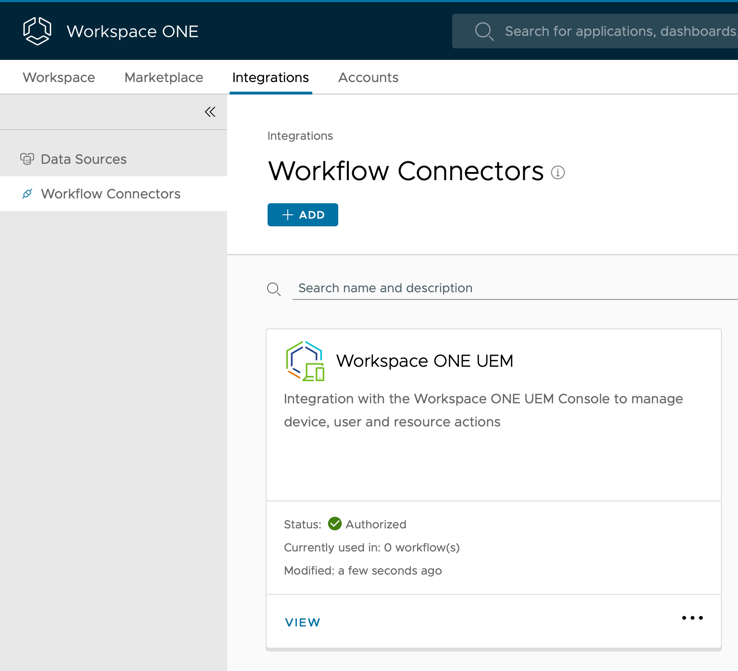
Using Reports to Gain Insights
After enabling Workspace ONE Intelligence, you are ready to explore the first core capabilities. In this exercise, you learn how to create reports that can mitigate issues, drive business decisions, and automatically share information with other departments.
Prerequisites
Before you can perform the procedures in this activity, you must have at least one device enrolled in your environment.
Creating Reports
In this activity, explore reporting capabilities by creating a report for enrolled devices. You will use a predefined template. For complete control of the report, use the Custom Report template to define your own criteria.
- In the Workspace ONE Intelligence console, click Reports.
- If this is your first time accessing the Reports section, click Get Started.
- Click Add > From Template.
- To select the Enrolled Devices template:
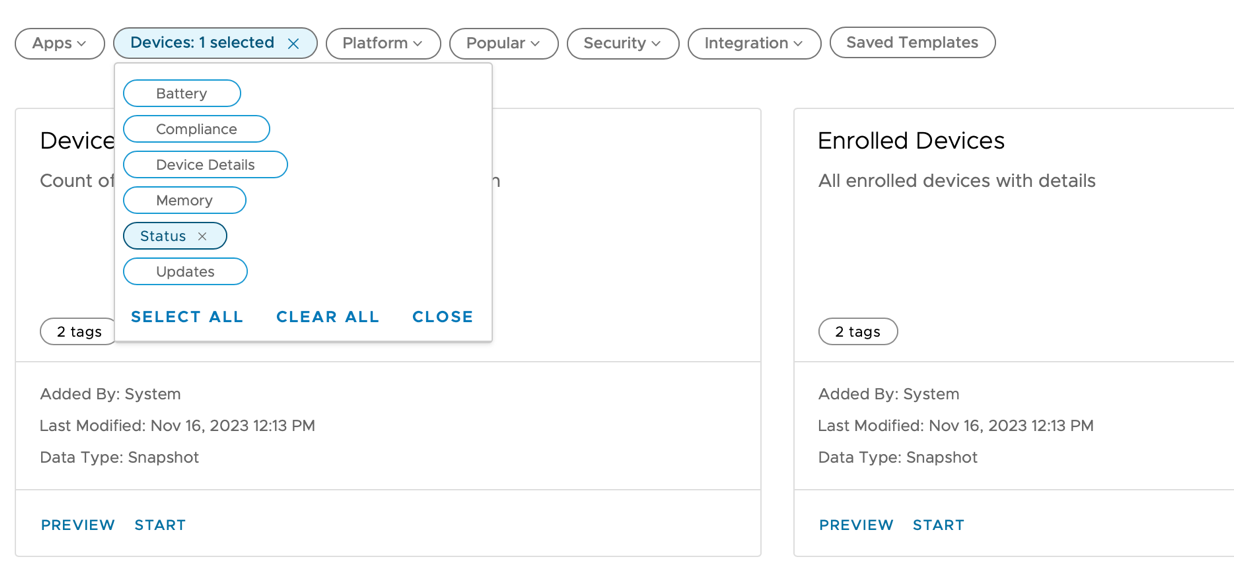
- Select Devices and then select the Status tag.
- Click Start for the Enrolled Devices template. Selecting this template creates a report about enrolled devices that displays data in pre-defined columns.
- To add a filter, perform the following steps:
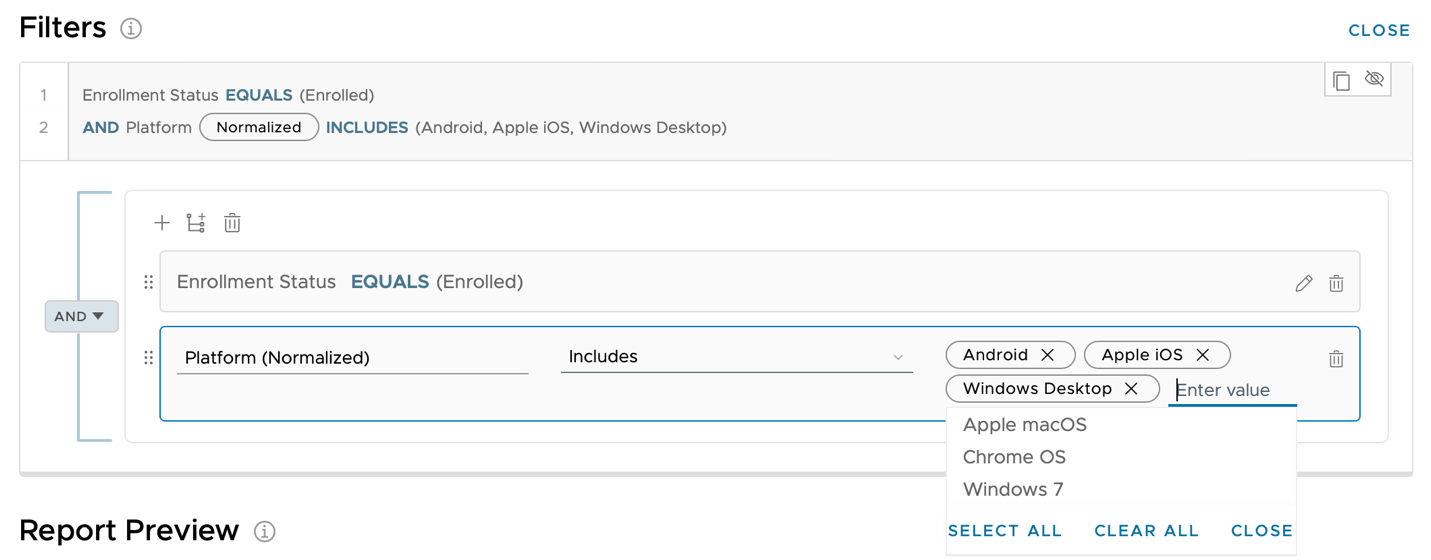
- Under Filters, click the + icon to add a new filter.
- Enter
platformin the first search field. - Select Platform under Devices from the drop-down menu that appears.
- Select Includes from the Search for value drop-down menu.
- Select Apple iOS, Android, and Windows Desktop from the final drop-down menu.
Note: You can manually type each platform name and press Enter to add them to the list.
The platform list is based on devices available in your environment, so you might not see all three requested platforms in this activity.
- Scroll down to the Report Preview section and click Refresh Preview. Observe how your currently enrolled devices automatically populate in the preview.
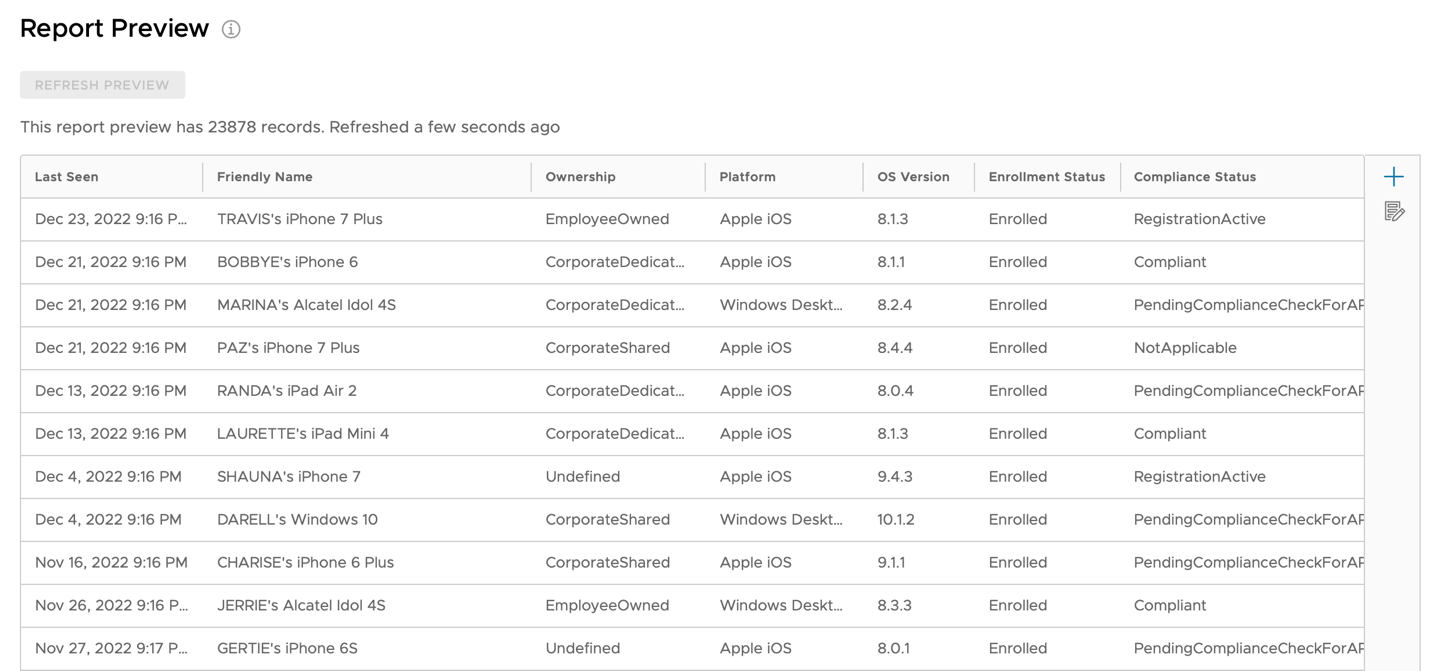
Note: The screenshot shown is from a test environment. Your report preview is based on your environment and will differ from the preview you see in the screenshot.
- To add report columns, perform the following steps:
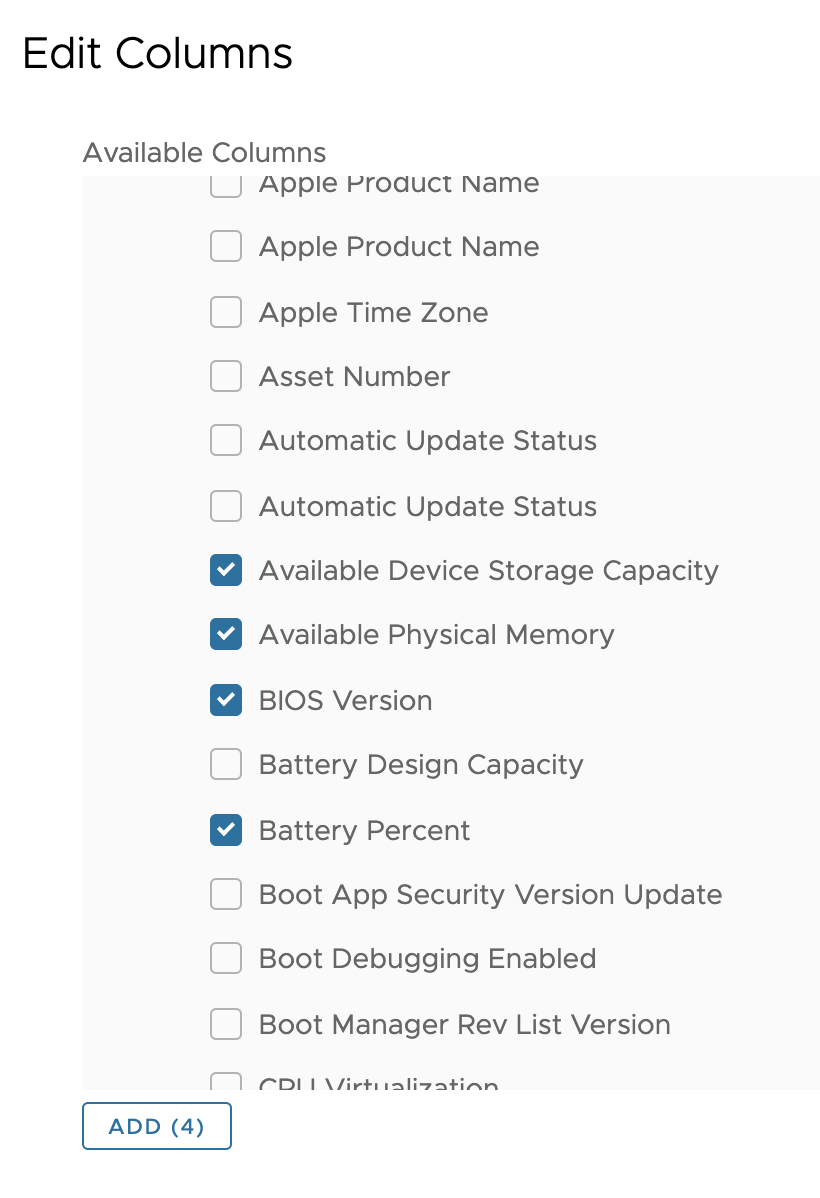
- Under Report Preview, click the Edit Columns button.
- Scroll down to find the Devices section.
Tip: You can click the arrows next to App Feedback and Apps to collapse these sections. - Under Available Columns, select the following:
- Available Device Storage Capacity
- Available Physical Memory
- BIOS Version
- Battery Percent
- Click Add.
- Click Save.
To change the column order on the report, use the Up and Down buttons.
- Click Save to save the report.
- After the report is saved, it is added to a list of available reports. Select the report that you want to review.
![]()
- From this view, you can configure additional management settings. Clicking on the Run option under the More menu generates the report for late download.
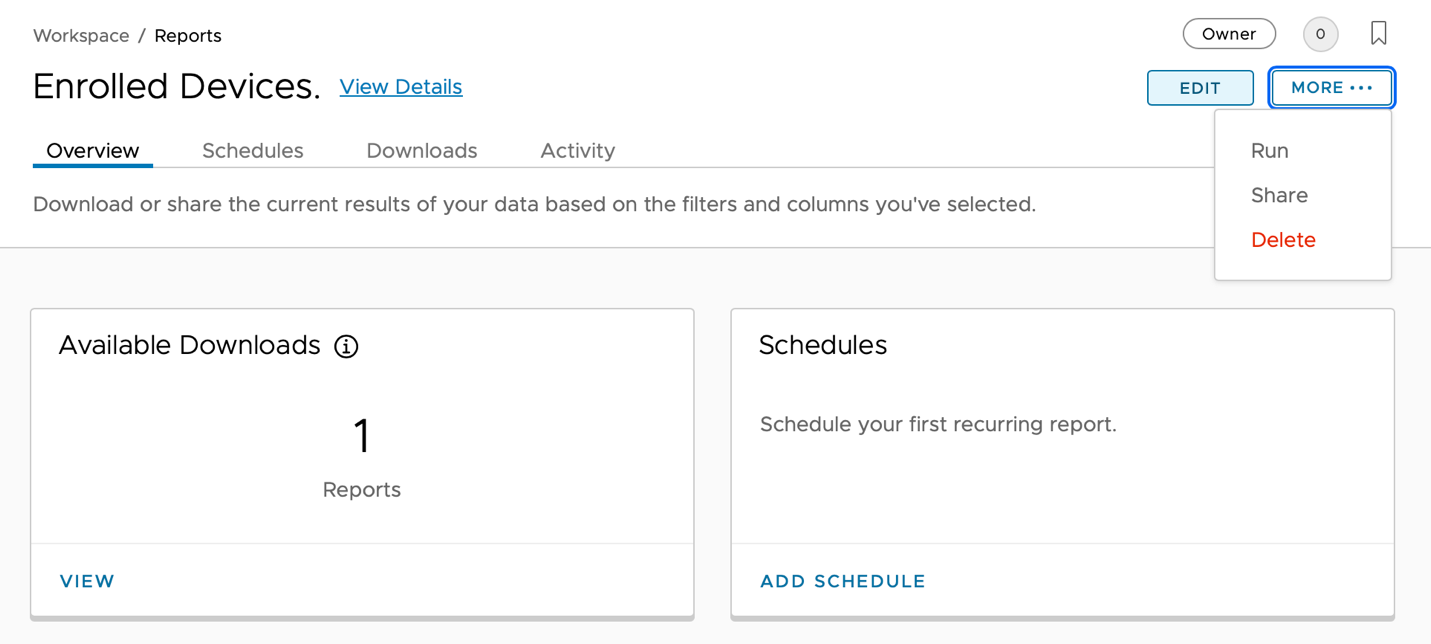
For more details, see Reports for Workspace ONE Intelligence.
Downloading Reports
After saving a report, you can almost immediately download it as a CSV file. In this activity, you download the CSV file for the Enrolled Devices report.
- To access the report's available downloads, select the Downloads tab.
- On the Downloads tab, click the Refresh icon and verify that the status is
Completed. - Click Download.
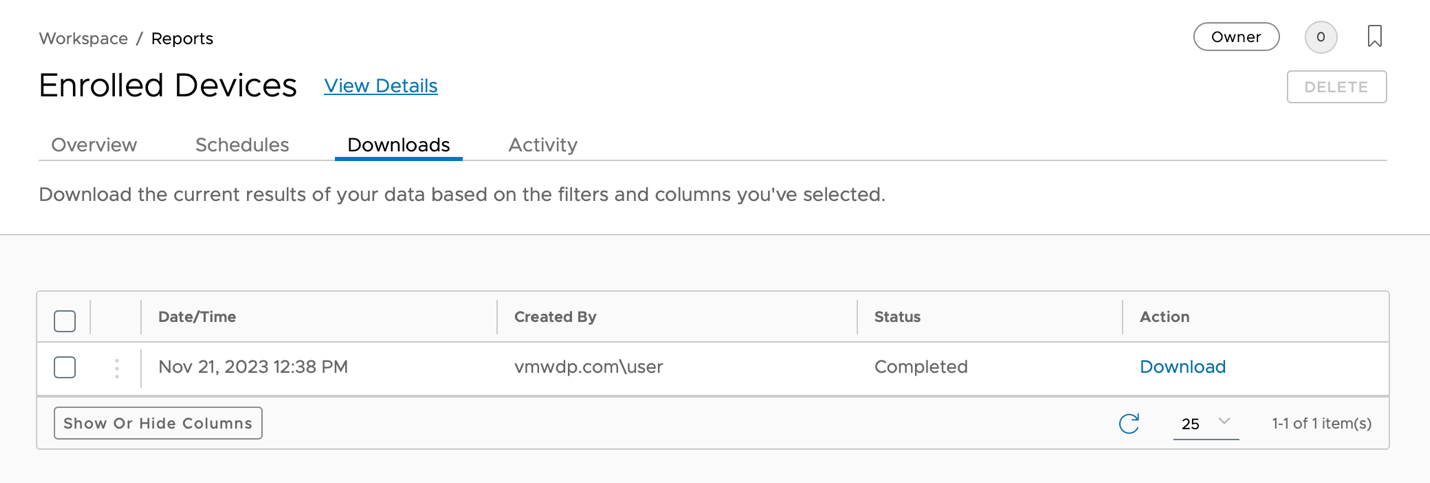
- Validate that a CSV of the Enrolled Devices report is downloaded.
Scheduling Reports
After saving a report, you can use scheduling to automate data collection and collaboration. In this activity, schedule the Enrolled Devices report to run on a monthly basis.
- Select Schedules and click Add.
- Configure the report schedule.

The following is an example:
- Enter a Schedule Name. For example,
Windows, Android, and Apple Enrolled Devices. - For Recurrence, select Monthly.
- For Day of the Month, select 1.
- For Starts At, enter 08:00 AM.
- For Ends, select a future date such as 06/30/2028.
- Click Schedule.
- On the Schedules tab, confirm that the schedule matches the parameters you defined.
- To delete a report schedule, select the report and click Delete.
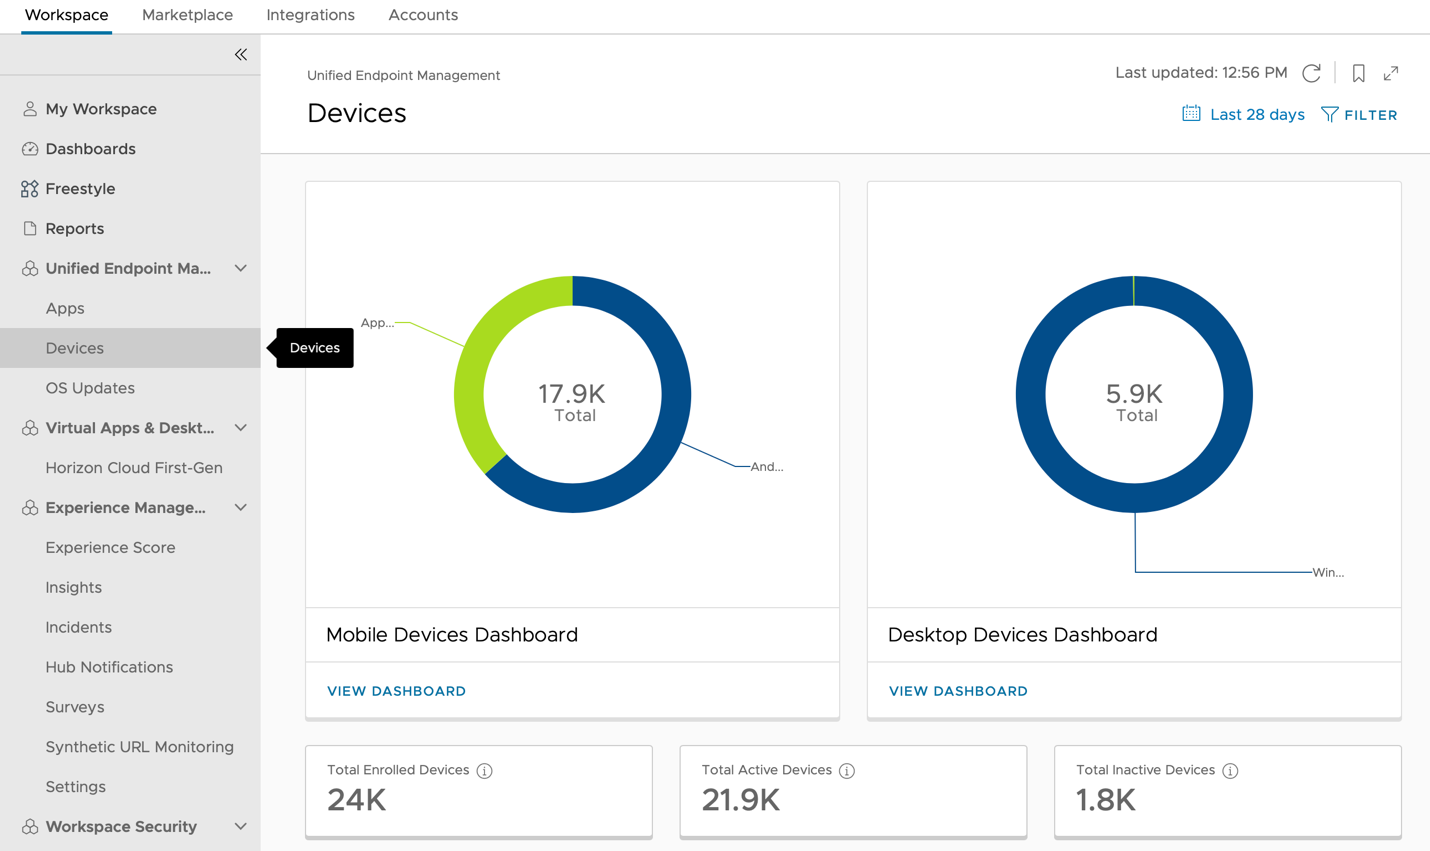
Using Dashboards to Visualize Data
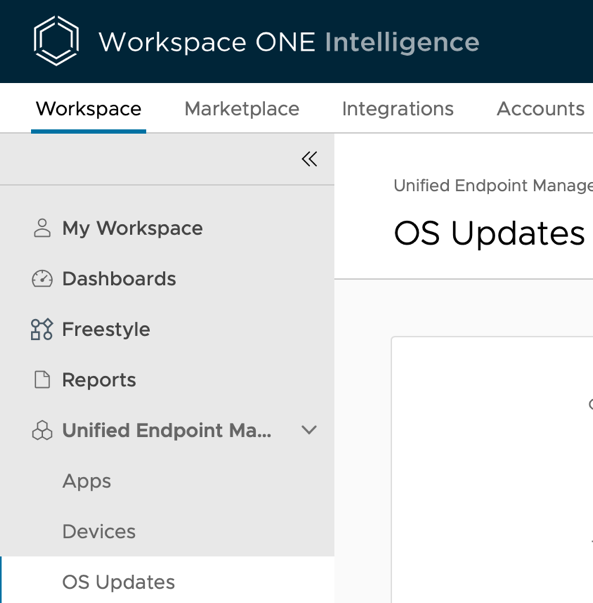
Dashboards are a powerful tool in Workspace ONE Intelligence that supplement reporting capabilities with rich visualizations of available data. Workspace ONE Intelligence provides several dashboards out-of-the-box to help administrators get first insight into their environment. Under Unified Endpoint Management on the left bar, you can get an understanding of the Devices, Apps, and OS Updates in your environment.
In this exercise, learn how to customize dashboards to visualize data in Workspace ONE Intelligence.
Prerequisites
Before you can perform the procedures in this activity, you must have at least one device enrolled in your environment.
Customizing the Dashboard View
As a supplement to its reporting capabilities, the Workspace ONE Intelligence dashboard displays critical business data in an easy-to-consume visual summary. Within dashboards, the configurable widgets allow you to customize the data that is displayed. In this activity, add a widget that shows enrollment information from the past 14 days.
- In the Workspace ONE Intelligence console, select the Dashboards tab.
- A Getting Started page is shown the first time you access the Dashboards page. If displayed, click Get Started.
- Click Add > Custom Dashboard.
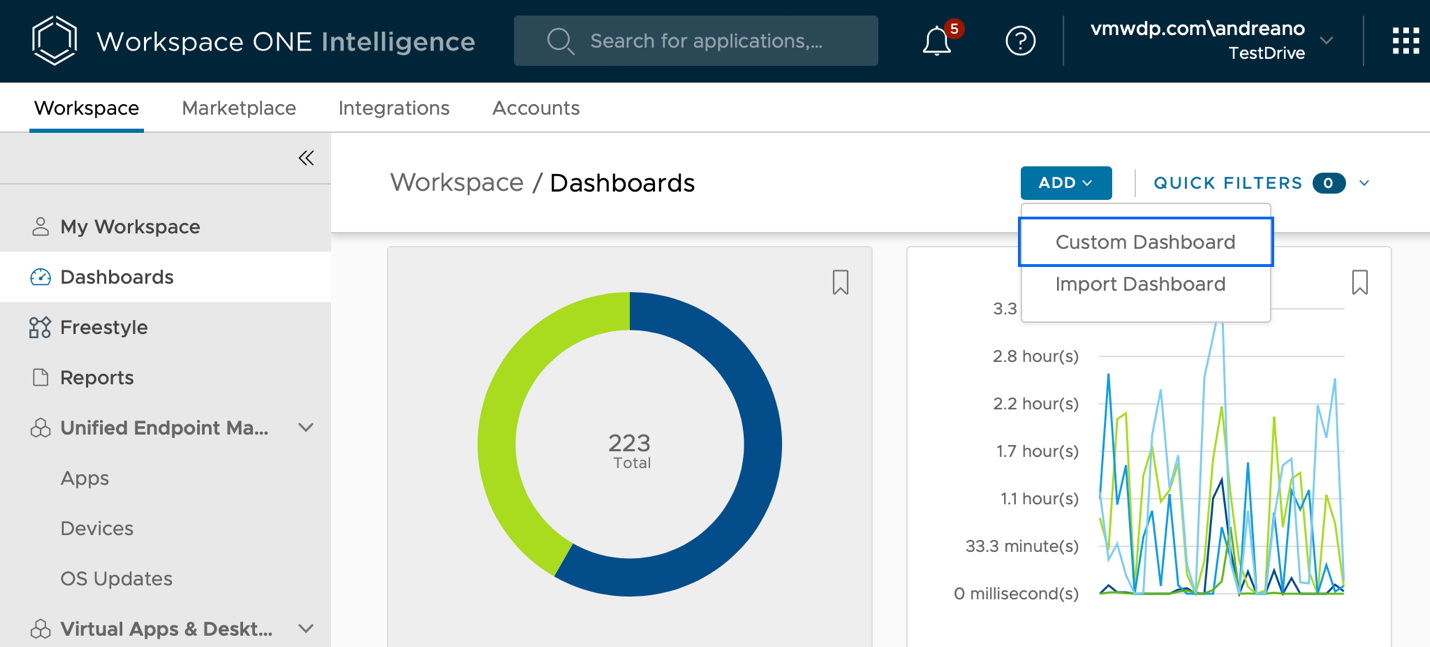
- Enter a dashboard name, such as
My Devices. - Enter an optional description for the dashboard.
- Click Save.
- Newly created dashboards, by default, have no information on them. You can add widgets to them and create custom dashboards to meet your business needs.
Click Add Widget and select the option Explorer Templates.
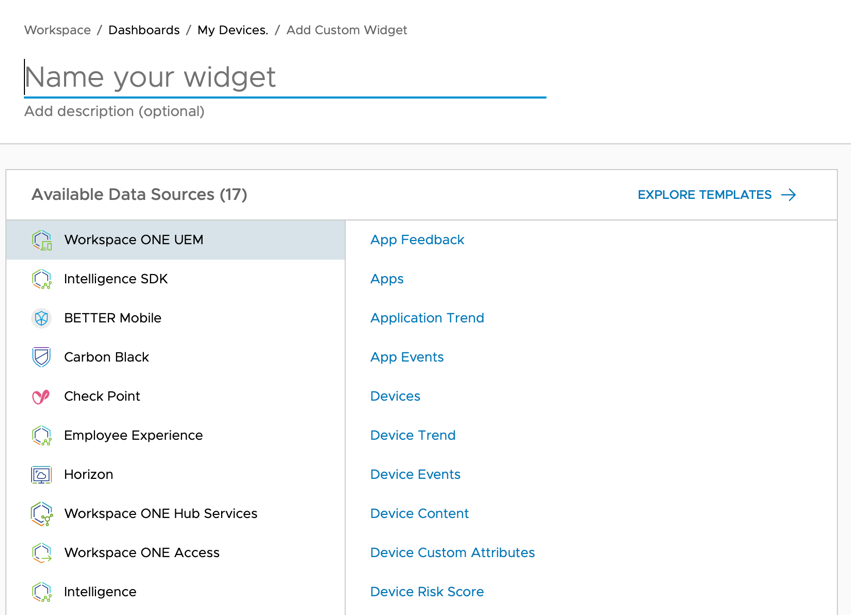
- Explore widget categories and templates. To begin creating a widget, you can select Custom Widget or select one of the built-in widgets by selecting the categories and tags. The list of categories will be based on the integrations configured on your Workspace ONE Intelligence and may differ from the image you see in this activity. The available categories can include:
- Apps
- Authentication
- Automations
- Devices
- Hub
- Platform
- Product
- Security
- Integration
- Bookmarks
When you start with Workspace ONE Intelligence for the first time, you will see multiple categories.
Then, use the tag for each category to filter the customizable templates to define the content your widget displays. For complete control of the widget's content, use the Custom Widget template to define your own criteria.
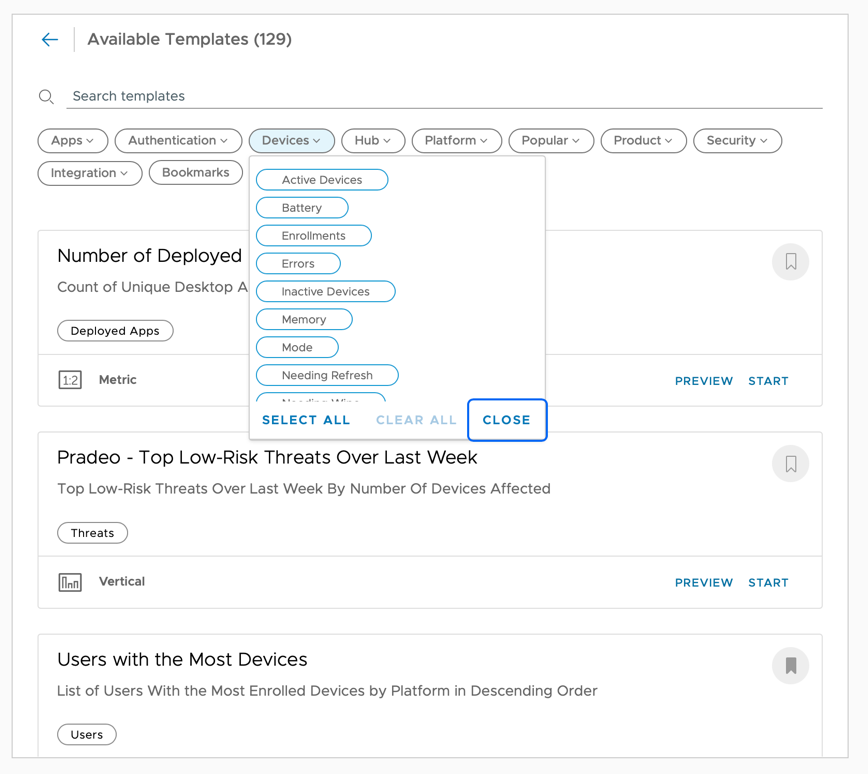
Feel free to click on each category to see the templates available to each.
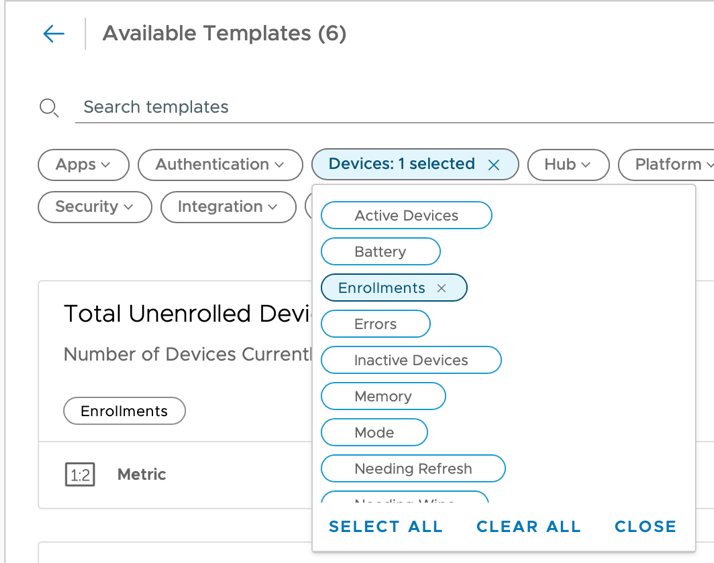
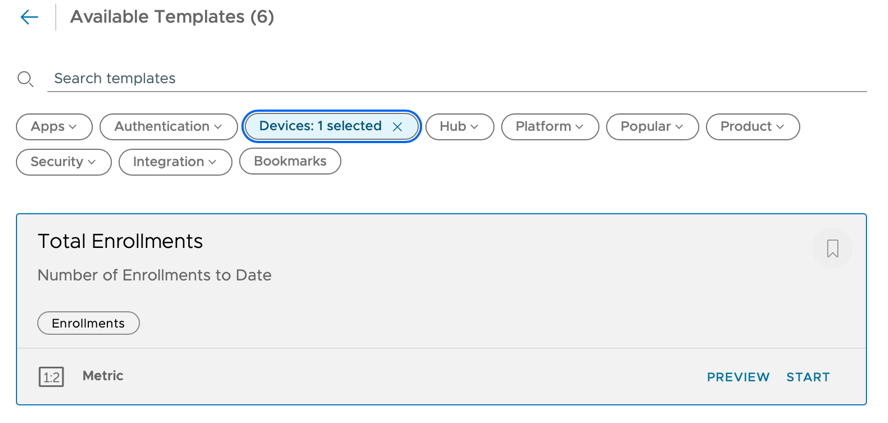
- Select the Devices category and select Enrollments.
- Click Start for the Total Enrollments template.
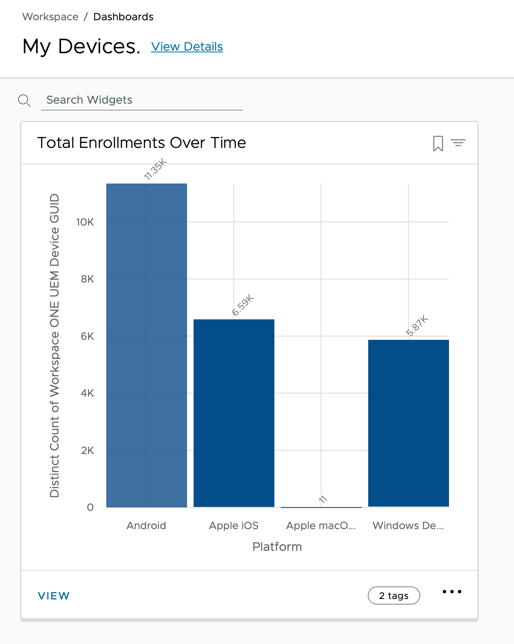
- To create a snapshot of total enrollments over time, configure the template as follows:
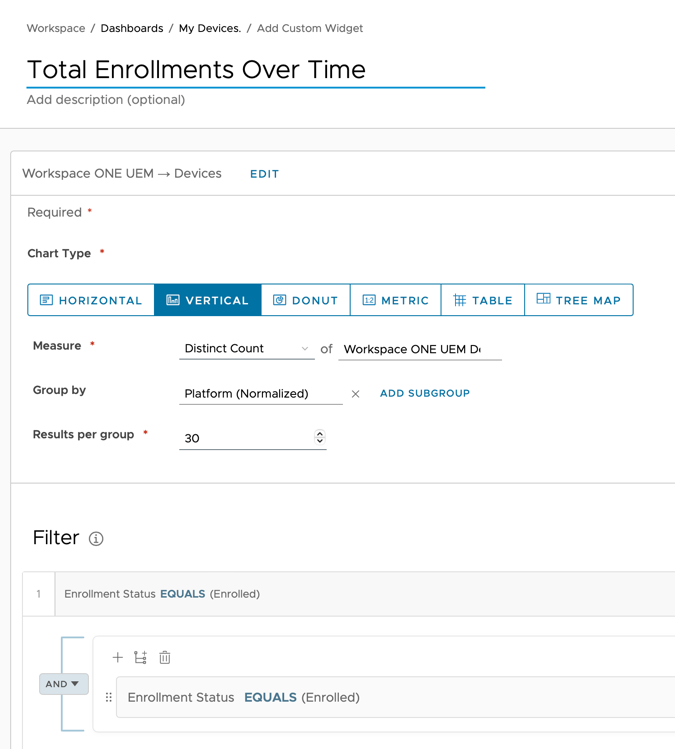
- Update the name to
Total Enrollments Over Time. - For Chart Type, select Vertical.
- For by Group, enter
Platform. - Click Save.
The dashboard will present the chart as configured based on the current data available in Intelligence.
After configuring the Total Enrollment Over Time widget, you can manage how it displays on your dashboard. In this activity, modify your dashboard view by repositioning and expanding the Total Enrollment Over Time widget.
By default, the new widget appears at the bottom of your dashboard. Because this is the first widget on this dashboard, it will be at the top.
- Customize the Dashboard:
- Click Total Enrollments Over Time (the chart title) and drag the widget to a new location on your dashboard.
- Click and drag the corners of the widget to change the width or height of the Total Enrollments Over Time widget.
- After you are satisfied with the position and size of the widget, click Save.
- Click Save to save the dashboard layout.
For more details, see Dashboards in Intelligence.
Using Dashboards to Enforce Device Compliance
In addition to its standard dashboards, Workspace ONE Intelligence also provides a set of security-focused dashboards. These dashboards query the entire environment to identify the most at-risk devices: compromised devices, passcode-less devices, unencrypted devices, and others. In this activity, learn how to Security Risk dashboards in Workspace ONE Intelligence can help you enforce device compliance and mitigate risk.
Increasing Compliance Across Devices
The Security Risk dashboards in Workspace ONE Intelligence gather reports on numerous device states and quickly identify high-risk devices. In this activity, you explore the following Security Risk dashboards Workspace ONE Intelligence: Threats Summary, Compromised Devices, Policy Risks, and Vulnerabilities.
- In the Workspace ONE Intelligence console, navigate to Workspace Security > Security Risk.
- View the Threats Summary dashboard.
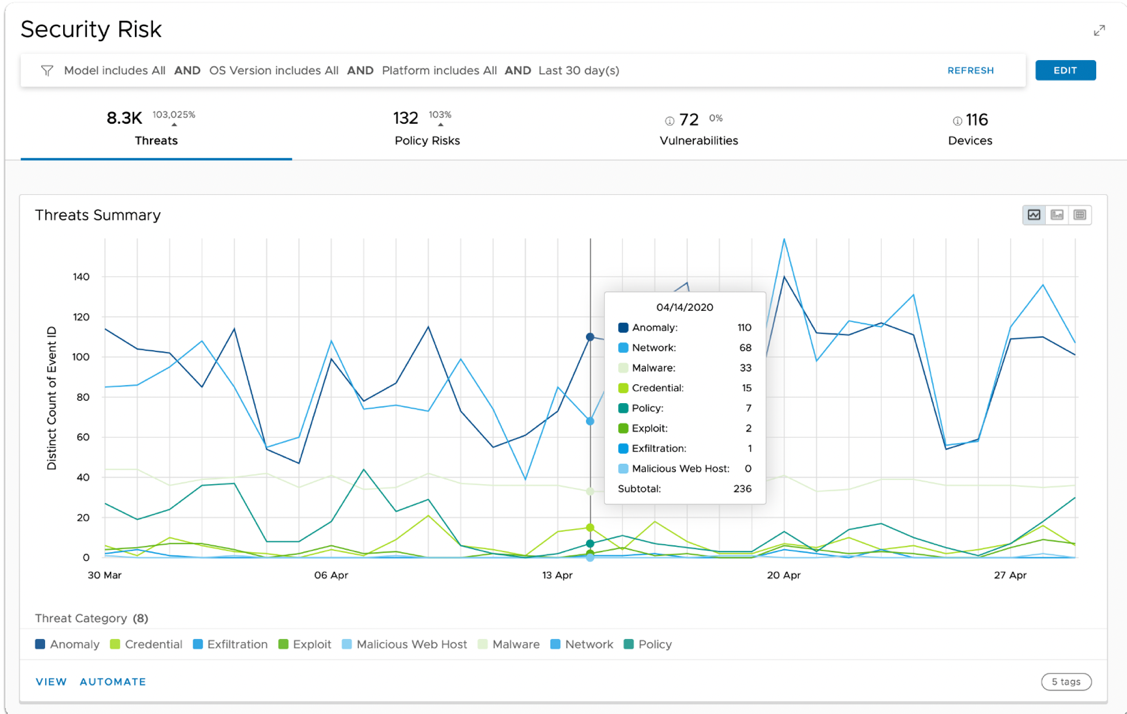
The Threats Summary dashboard appears by default and displays the number of threats reported by the Trust Network solutions that are integrated into your environment.
Workspace ONE Intelligence integrates with several security endpoint solutions that report threats, such as Anomalies, malware, policy violations, suspicious network activities, and so on. The threats are reported to Intelligence by the Trust Network solutions almost immediately, and you can navigate through each data point to identify the threats and devices impacted by that threat.
Scroll down to the Compromised Devices chart.
- View the Compromised Devices dashboard.
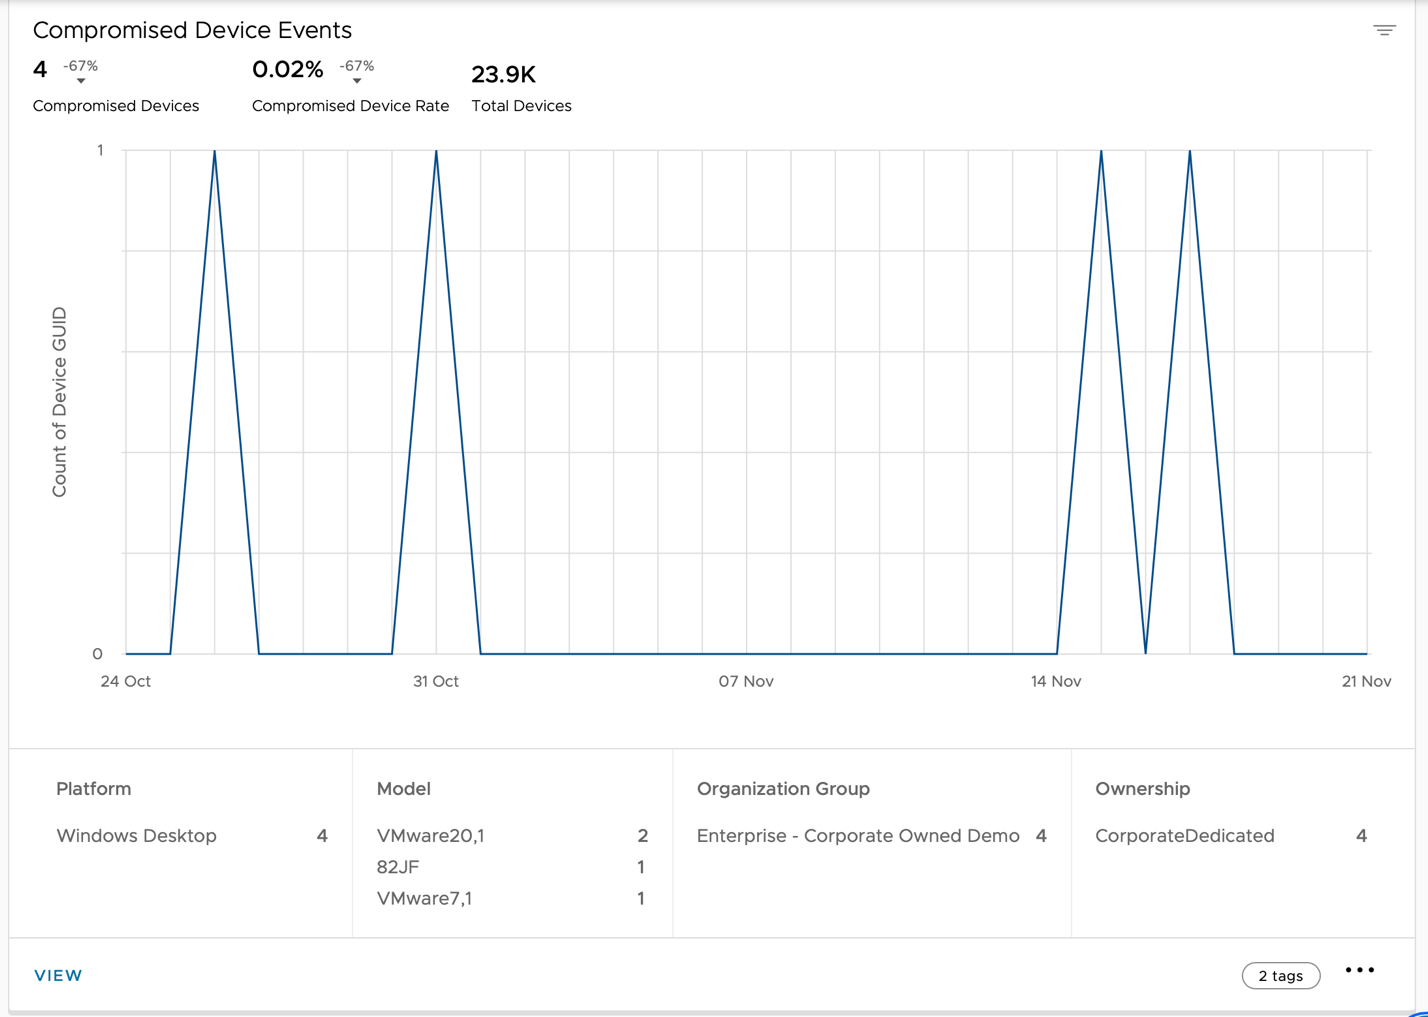
The Compromised Device dashboard appears by default and displays the number of devices that were reported as compromised in the past 28 days. A device becomes compromised when it violates the compliance policies defined by the IT administrator. Common compliance policies include deny listed apps, devices not seen in the past 24 hours, no passcode, and more.
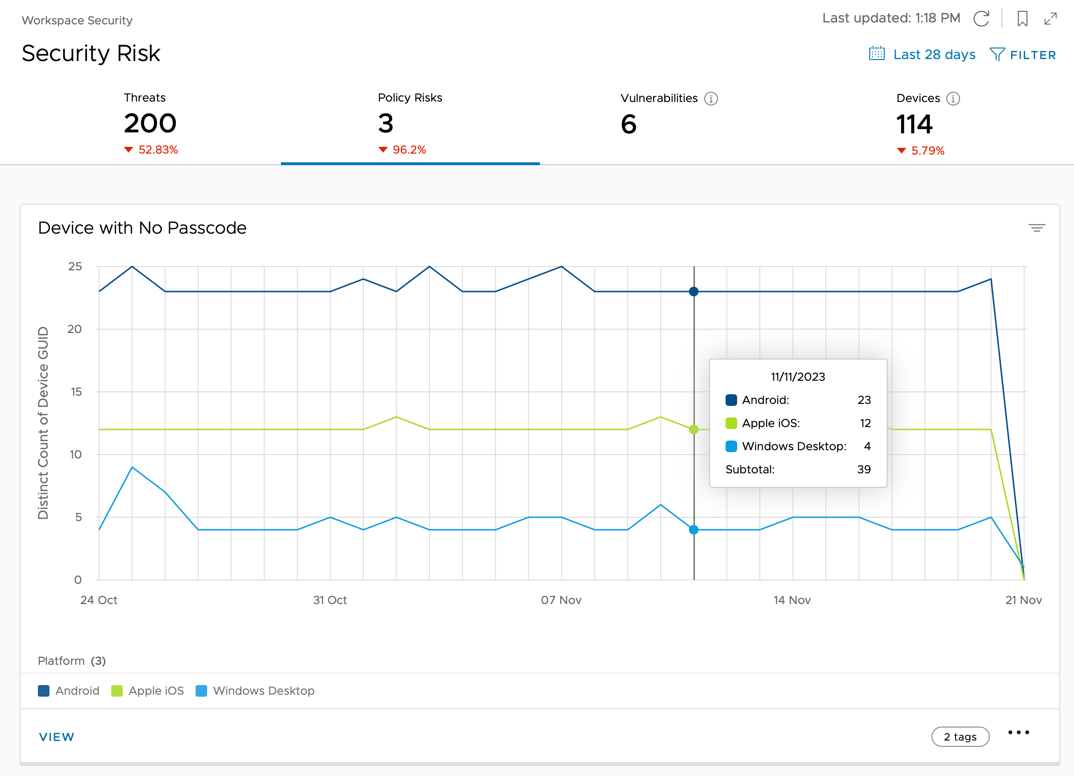
- Select Policy Risks to view the number of passcode-less devices detected in the past 30 days.
Then, after you understand the scope of the issue, use automation to mitigate the risk. For example, you can create a rule to automatically move a passcode-less device to quarantine, or remove its access to corporate data.
- Scroll down to Unencrypted Devices. This chart shows the total number of unencrypted devices identified daily by Workspace ONE Intelligence.
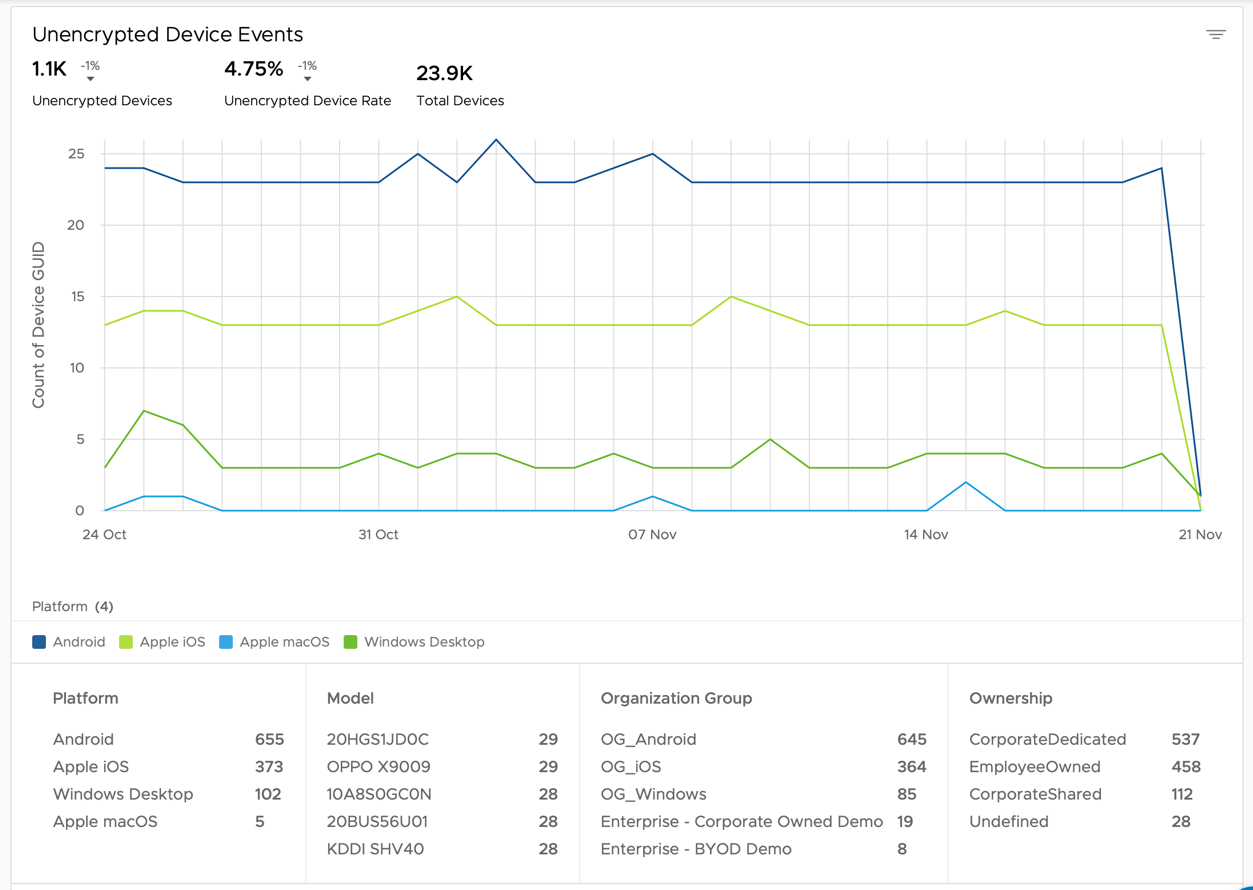
- Point to the data points for additional details about the number of devices per platform.
- Click View to obtain a detailed list of devices.
- Click Security Risk: Policy Risks to return.
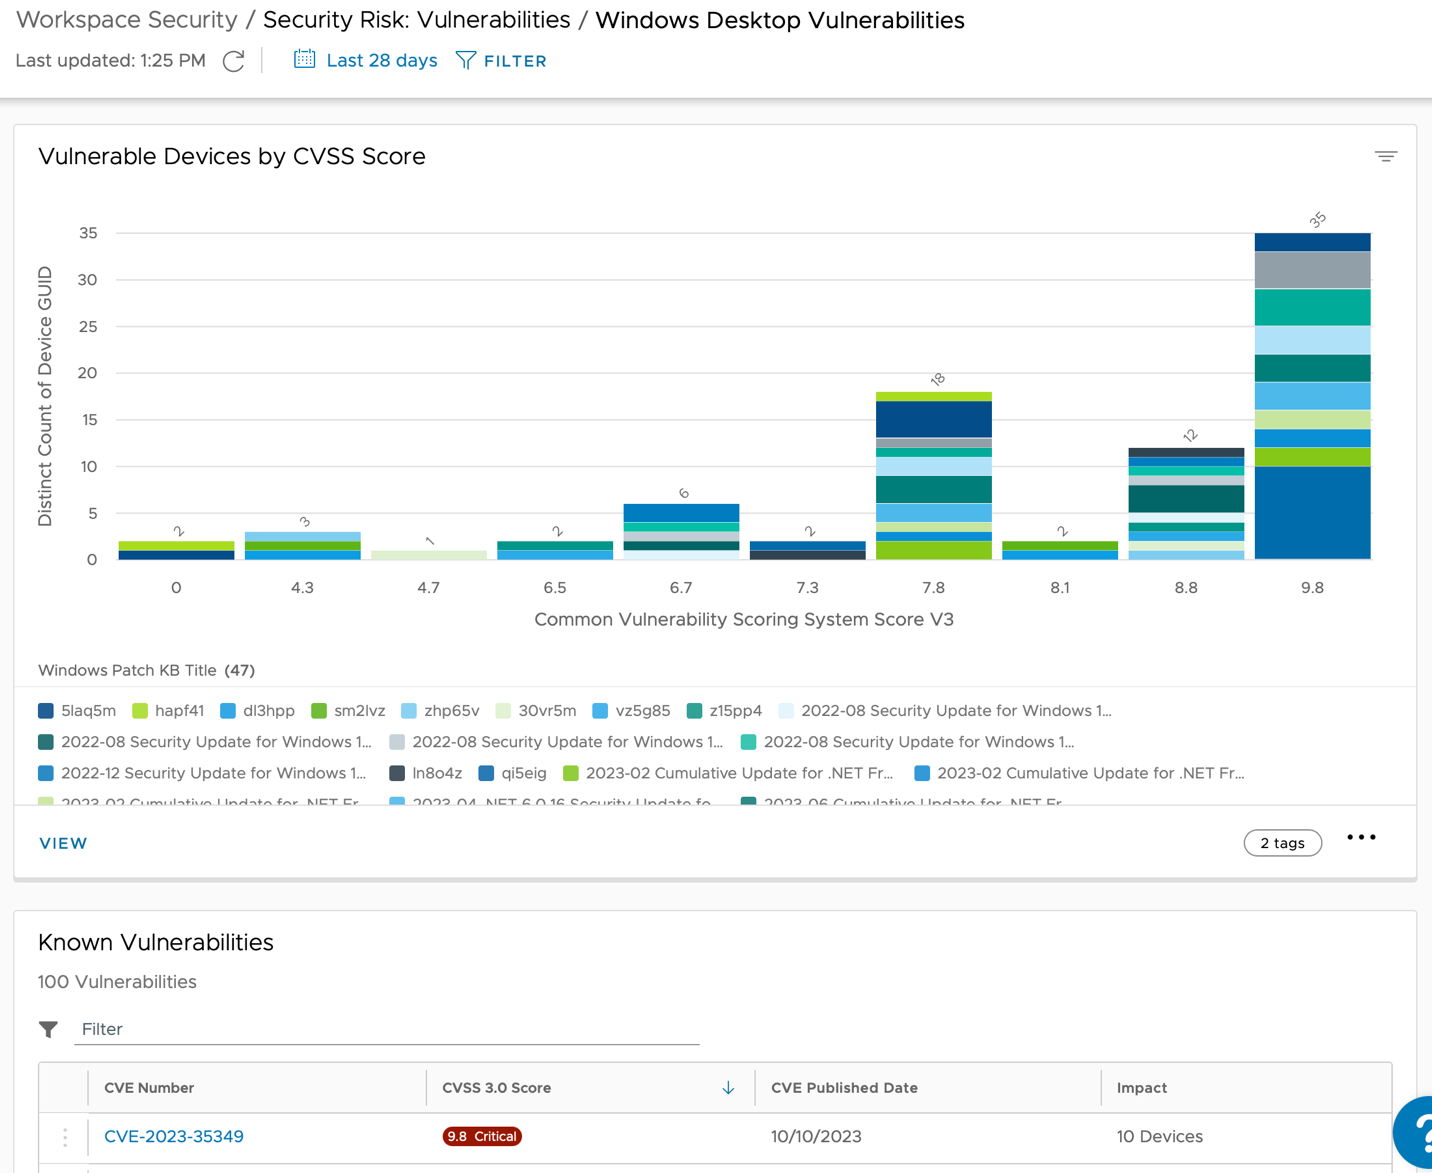
- Select the Vulnerabilities tab to view the number of vulnerable Windows and Mac devices in the last 30 days.
Without encryption, confidential information is unprotected, and can easily land in the wrong hands. To mitigate this risk, create policies to enforce device encryption. For example, you can create a policy to block corporate access until the device is encrypted through Workspace ONE UEM.
For more information, see Workspace Security > Security Risk.
Workflows with Freestyle Orchestrator
You can proactively identify issues, troubleshoot, and remediate them with automation using the Freestyle Orchestrator on Intelligence. Freestyle Orchestrator on Intelligence (formerly Intelligence Automations) is a low code, no code workflow platform that helps IT admins automate complex business use cases by sequencing tasks based on a trigger. For example, from data gathered about battery health throughout your organization, you can automate an action to notify IT through Service Now tickets requesting to replace each degraded battery. You can set this up proactively, so new batteries arrive before the users even know they need one.
- Automation engine – Workspace ONE Intelligence has a built-in automation engine that can create rules to take automatic action on issues that come up, such as security, efficiency, user experience, and so on. You can orchestrate and automate IT workflows based on pre-defined rules and a rich set of parameters. You can even extend the workflows to third-party tools by using the REST API.
- Efficiency and agility – You can speed up IT tasks, issue resolutions, and patch rollouts with a powerful automation engine that spans internal and third-party tools in your environment.
To get the most out of your workflow experience, it’s important to understand the building blocks within a workflow. A workflow consists of a trigger caused by a state change or trend that initiates a set action through Workspace ONE or an integrated third-party service.
- Data Source – Primary source of data that will be monitored by the workflow engine in Workspace ONE Intelligence to initiate the workflow.
- Triggers – The workflow engine in Workspace ONE Intelligence monitors incoming and existing data based on the Data Source that triggers a workflow based on the rule’s conditions defined by the administrator. You can customize the workflow to act on unique scenarios in your Workspace ONE environment and third-party services. The triggers can act on states that reflect their configuration immediately after you save them or can then monitor data for state changes and act as configured.
- Actions – Workflows offer many actions that help solve problems related to daily IT tasks, deployment, and compliance across Workspace ONE and third-party products. The workflow engine executes actions in a sequential order based on the configuration within the workflow canvas.
Freestyle Orchestrator is also available in the Workspace ONE UEM console, to learn more on how to use Freestyle on UEM see the Getting Started with Freestyle Orchestrator.
Workflow applied to Patch Remediation
Identifying security risks across all Windows devices is a challenge particularly when those devices are not managed. However, combining device management capabilities with Workspace ONE UEM allows IT administrators to report and approve patch deployment using Workspace ONE UEM.
In an environment with thousands of devices, patches being released weekly, and distributed responsibility between IT and InfoSec teams, it is crucial to provide unified visibility and real-time data to drive accurate decisions and minimize any security risk to the business.
Workspace ONE Intelligence integrates with Workspace ONE UEM to provide unified visibility and real-time data. In addition, Intelligence brings automation workflows that allow IT to automate the patch approval process and continue monitoring the environment.
In this exercise, you identify the multiple Windows OS Versions and patches deployed across your environment, identify Windows devices that are missing critical OS patches, use automation to push the correct patches to the corresponding devices, and then monitor the remediation process.
Note: Before you begin, you must have an enrolled Windows device.
Identifying Windows Devices Missing Critical OS Patches
In this activity, use the OS Updates dashboard to view details about OS versions deployed and patch status across all managed Windows devices.
- In the Workspace ONE Intelligence console, navigate to Workspace > Unified Endpoint Management > OS Updates.
- Click View Dashboard for one of the cards, for example, Windows Desktop.
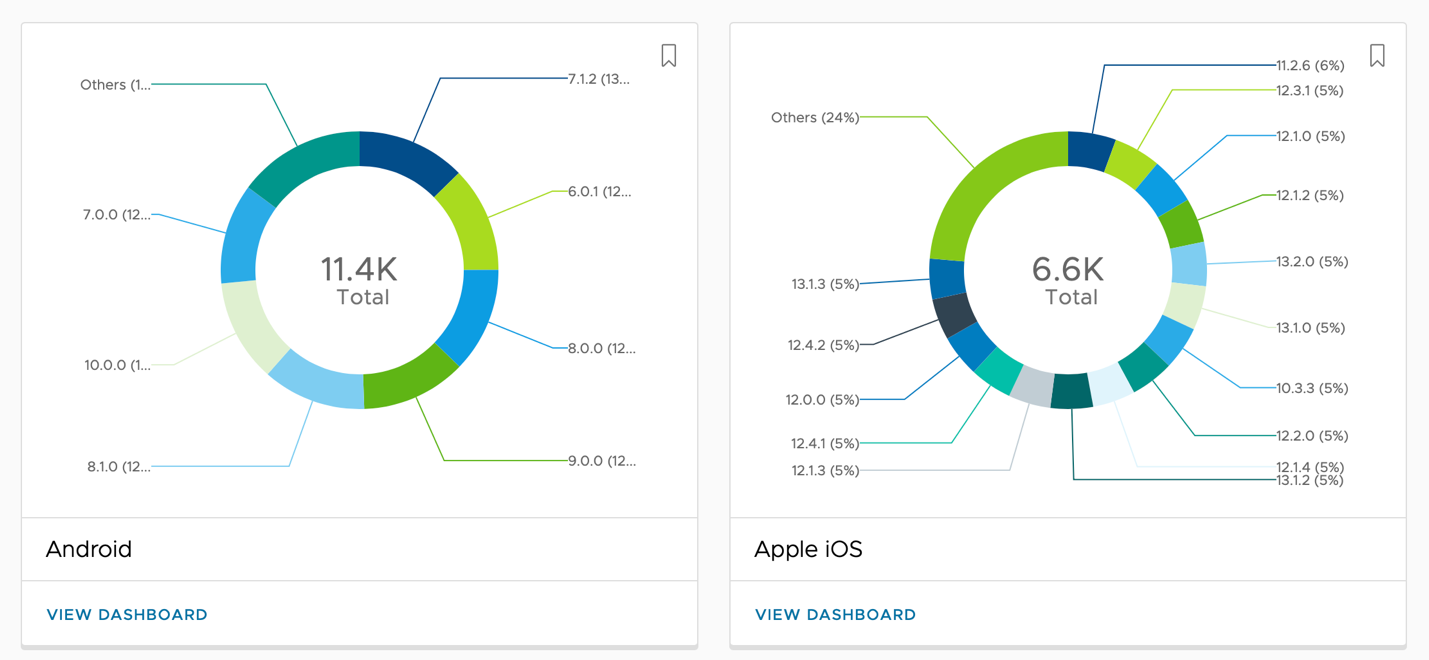
The OS Updates dashboard shows how heterogeneous the environment is based on the number of OS versions available on your environment per platform.
The dashboard only shows the cards based on the current devices managed in your environment. For this exercise, if you enroll only one Windows device, it only shows one card.
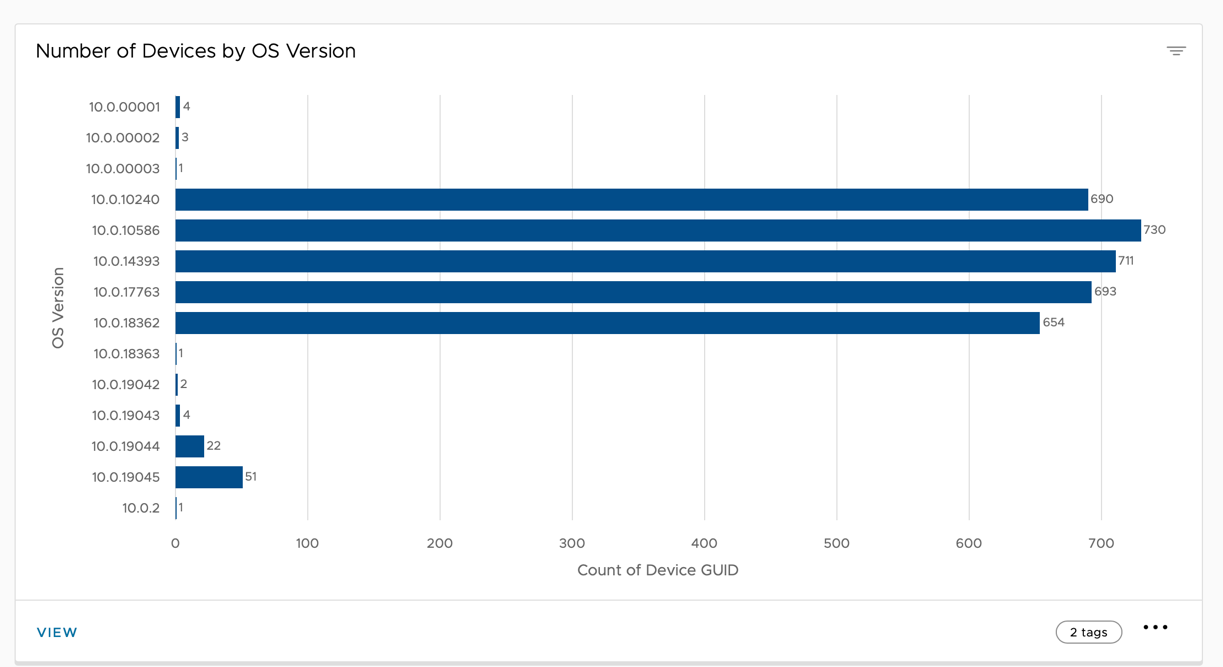
- Explore devices by OS version.
The OS Versions dashboard includes the Number of Devices by OS Version chart, which allows you to understand the number of OS versions across the Windows managed devices in your organization.
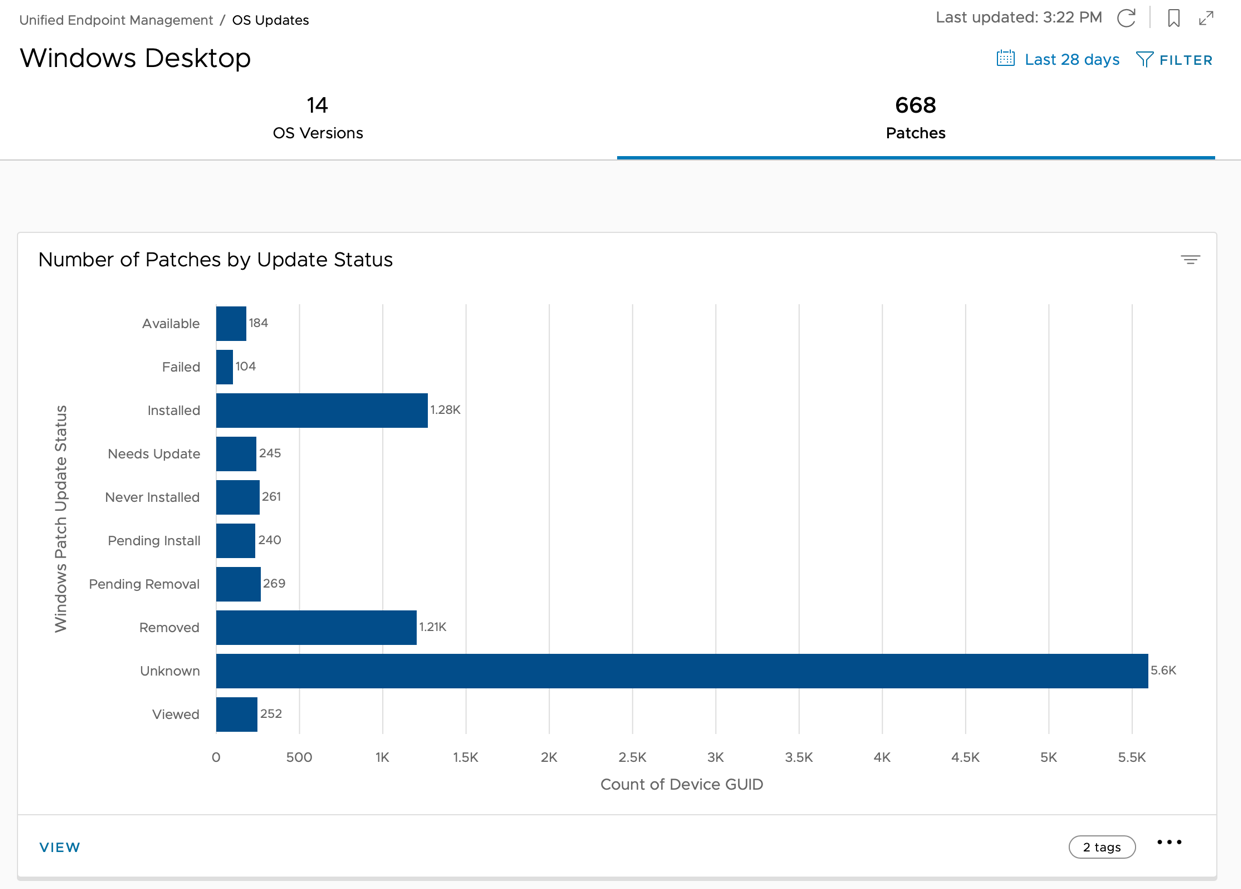
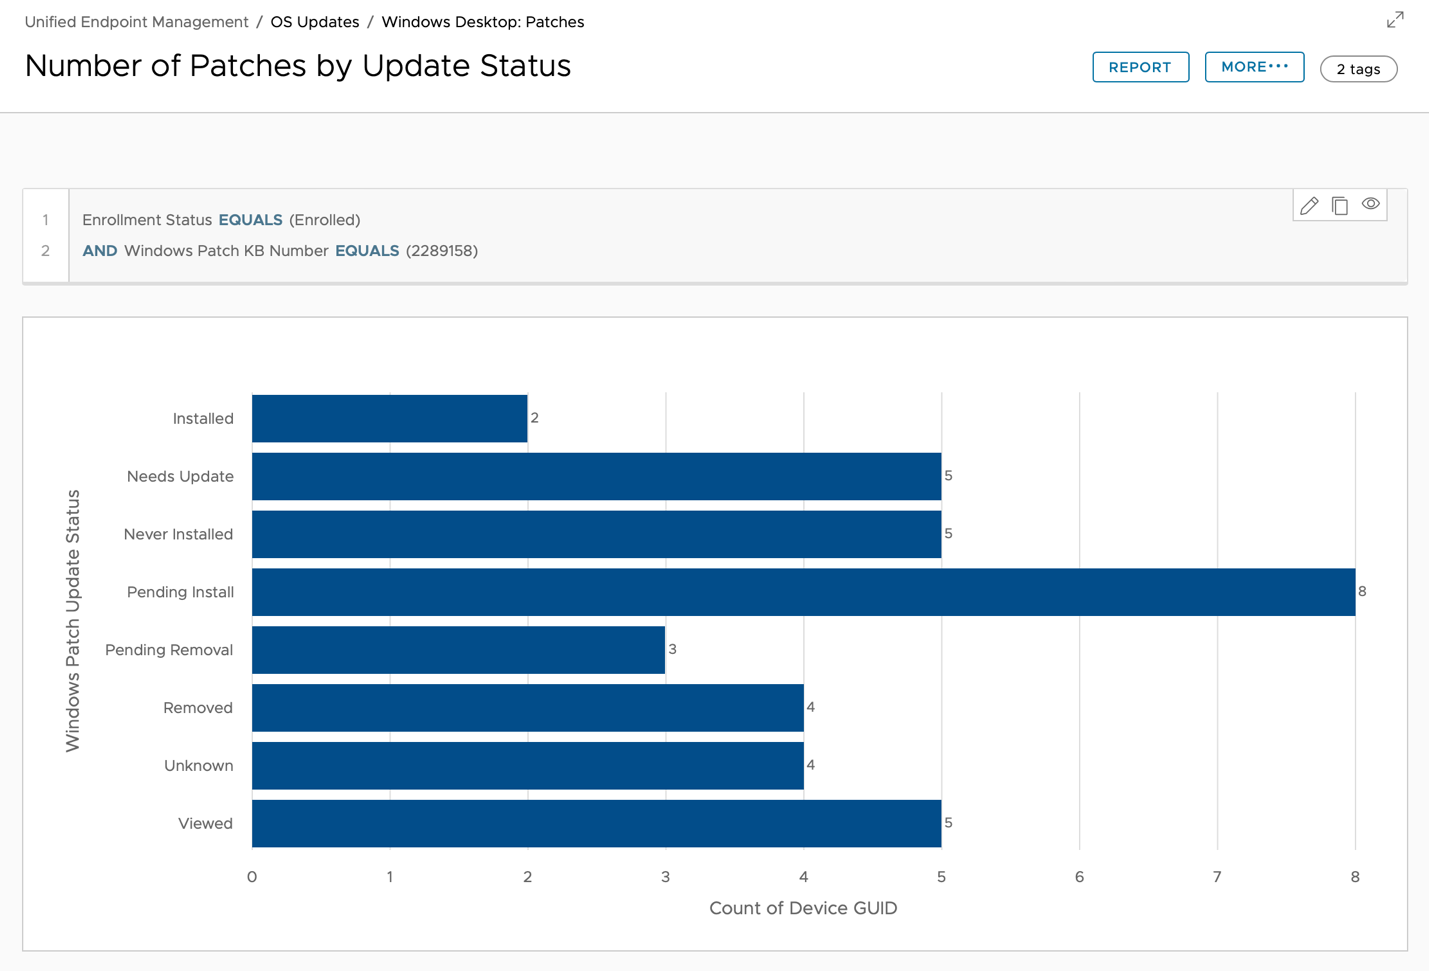
- Select Patches to find the Number of Patches by Update Status chart. This chart helps you to focus and prioritize which available and failed patches must be installed as soon as possible.
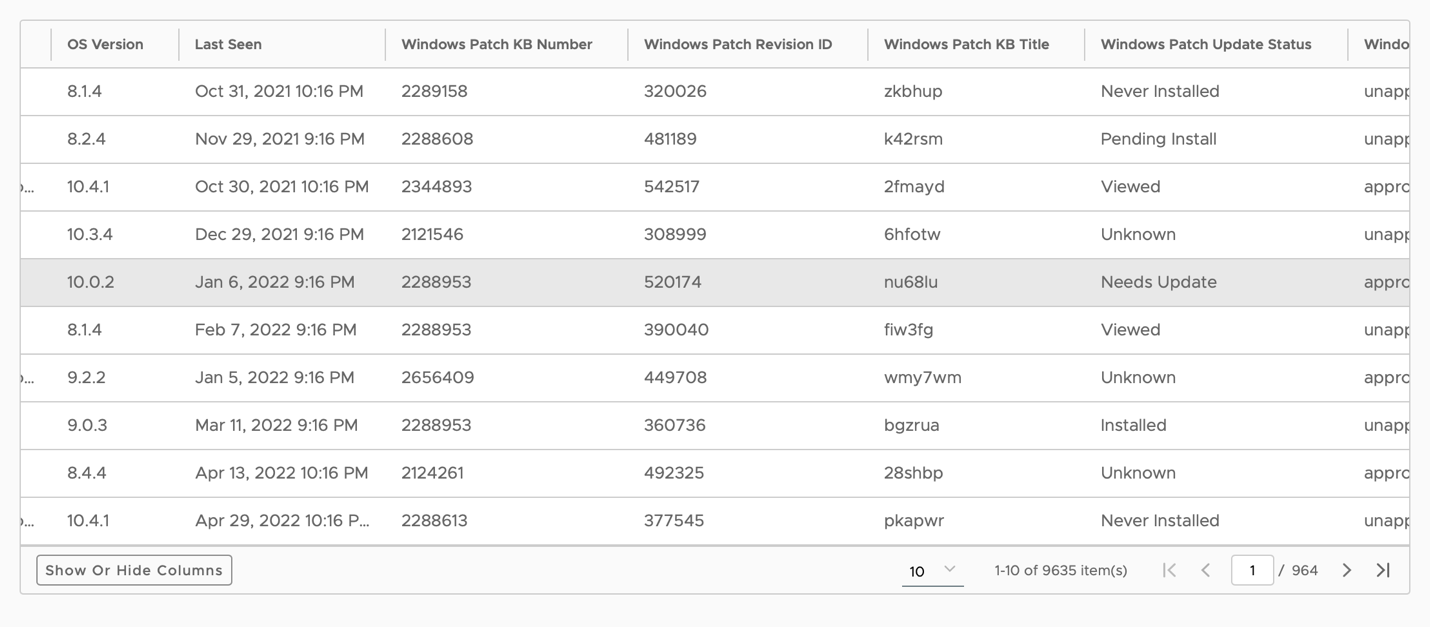
- Click the Available bar and then click View to see a list of OS updates available to install per device. This list includes all the devices and related available OS updates. The column Windows Patch Update Classification can help you to prioritize which patches must be installed first to improve device security and minimize risk for the organization.
- Filter for a specific Windows patch (KB).
For this exercise, we used KB 2289158 to automate the deployment. If you don't have KB 2289158 in your environment, choose another available KB and use that as the reference for this exercise.
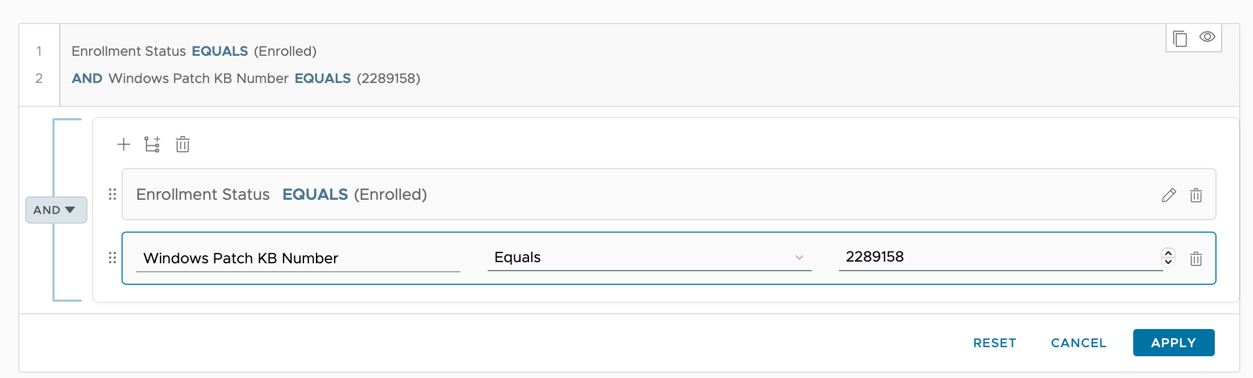
- Click Edit.
- Enter
Windows Patch KB Number. - Enter
4503308. - Click Apply.
- Review devices that require a patch and its status.
Using Automation to Remediate Patches
After identifying the devices at risk, create an automated process that pushes the correct patches to the devices.
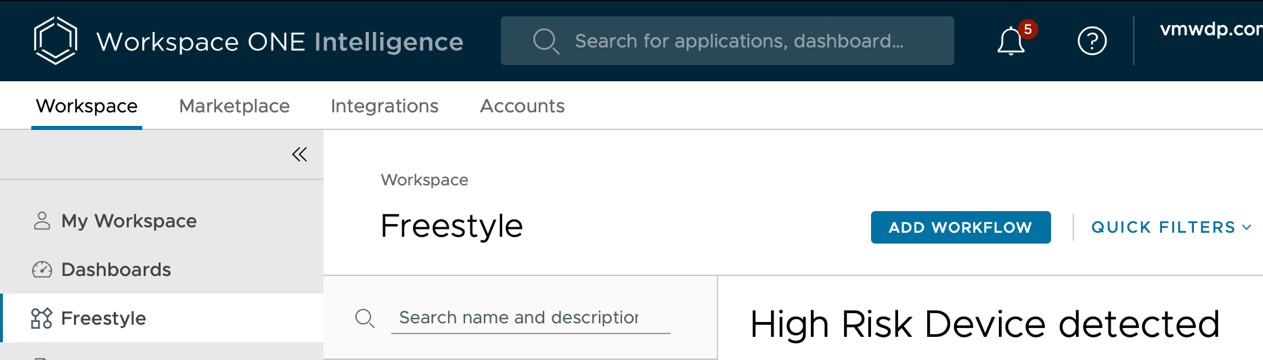
- Navigate to Workspace > Freestyle >
- Click Add Workflow.
- Name the Workflow. For example Patch KB4503308
- Select Workspace ONE UEM > Device as Data Source
- Select Automatic for Trigger Settings.
- Define the Trigger Rules as:
For this exercise, use KB4503308 to automate the deployment.
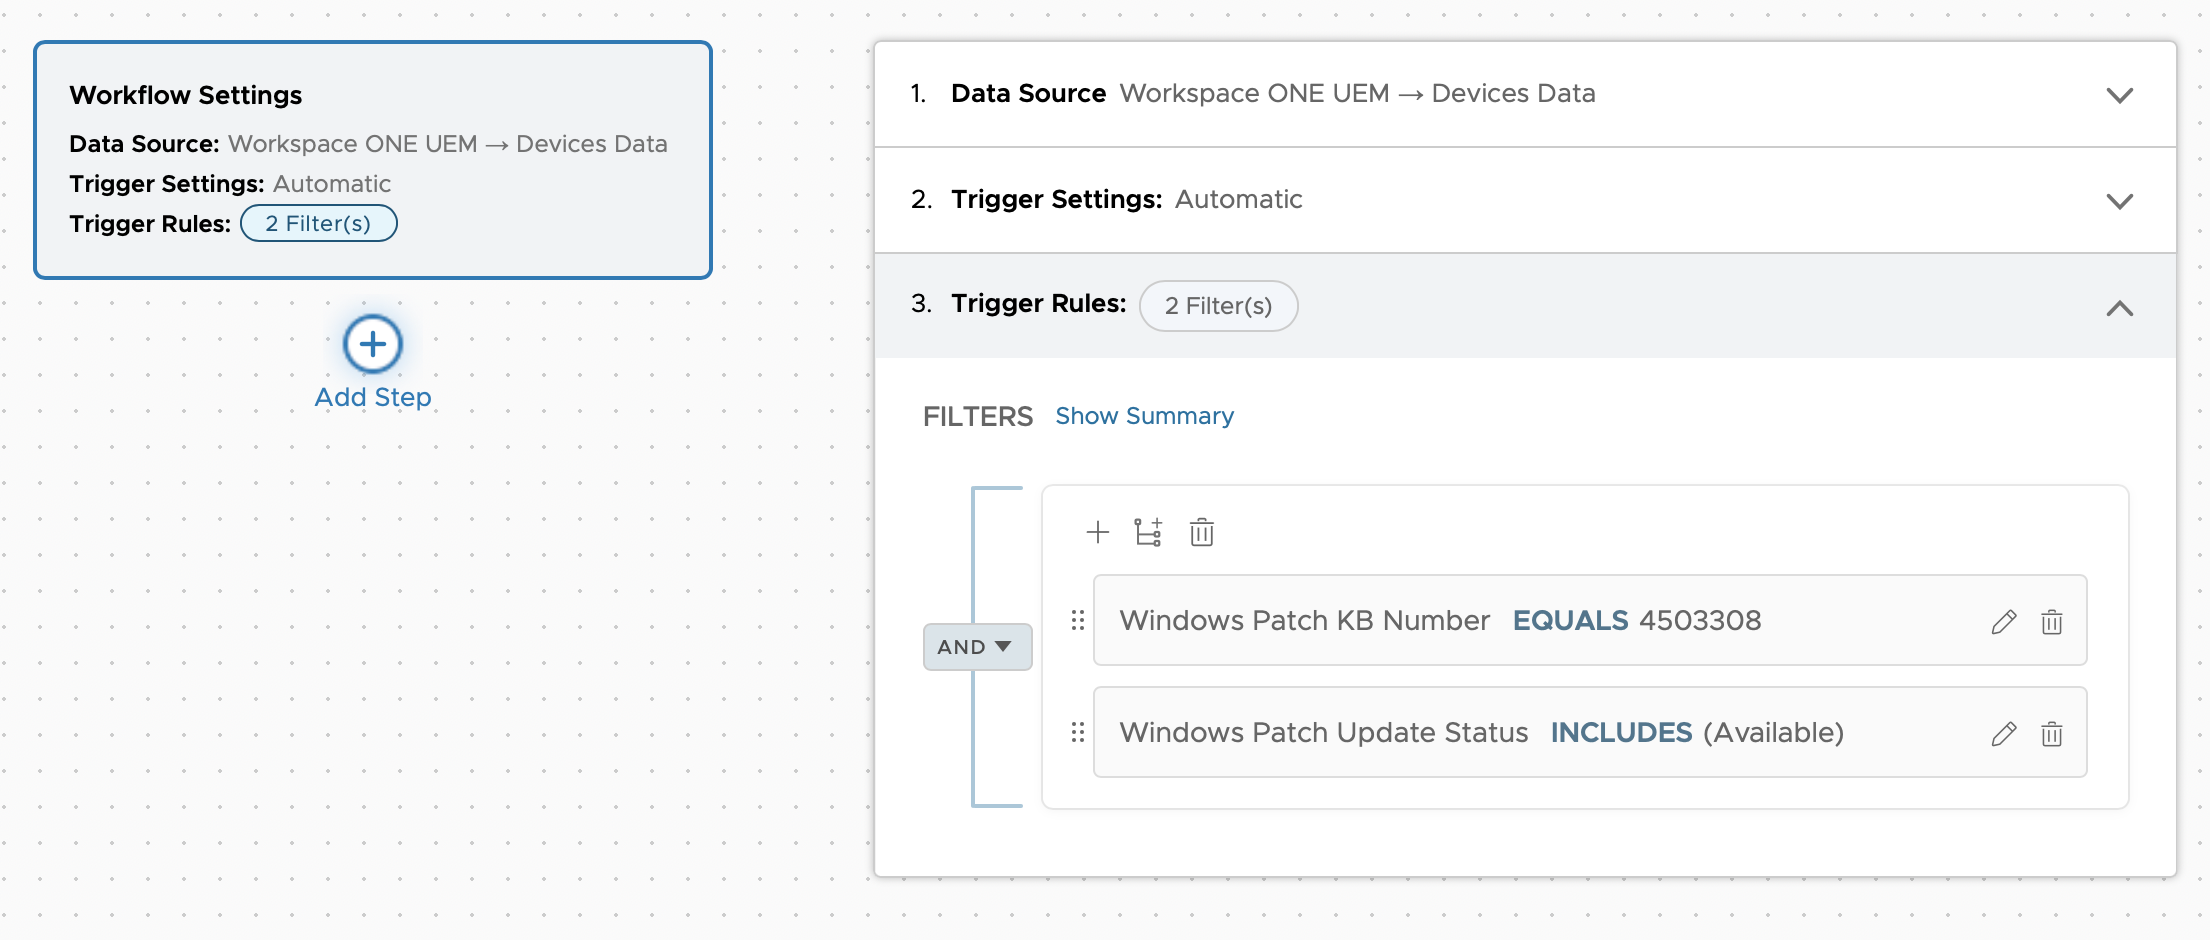
- Add the following condition, select Windows Patch KB Number.
- Select Equals.
- Enter the KB Number
4503308. - Click + to add a second filter.
- Select Windows Patch Update Status.
- Select Includes.
- Select Available.
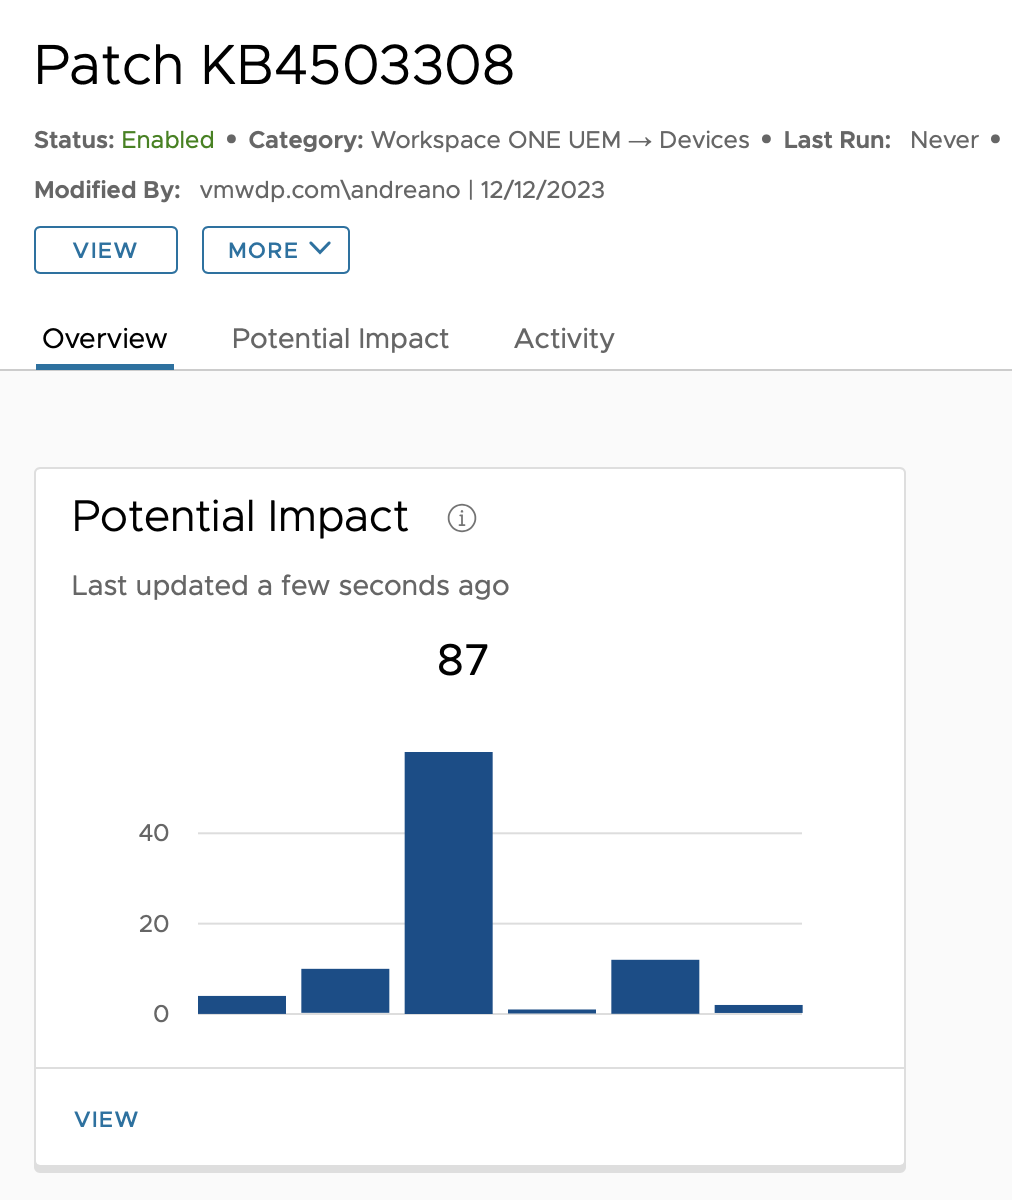
Based on the filter conditions, Intelligence reports the number of devices where patch 4503308 is not installed. Click the Refresh link for the Potential Impact to see the filter results.
- Add an Action.
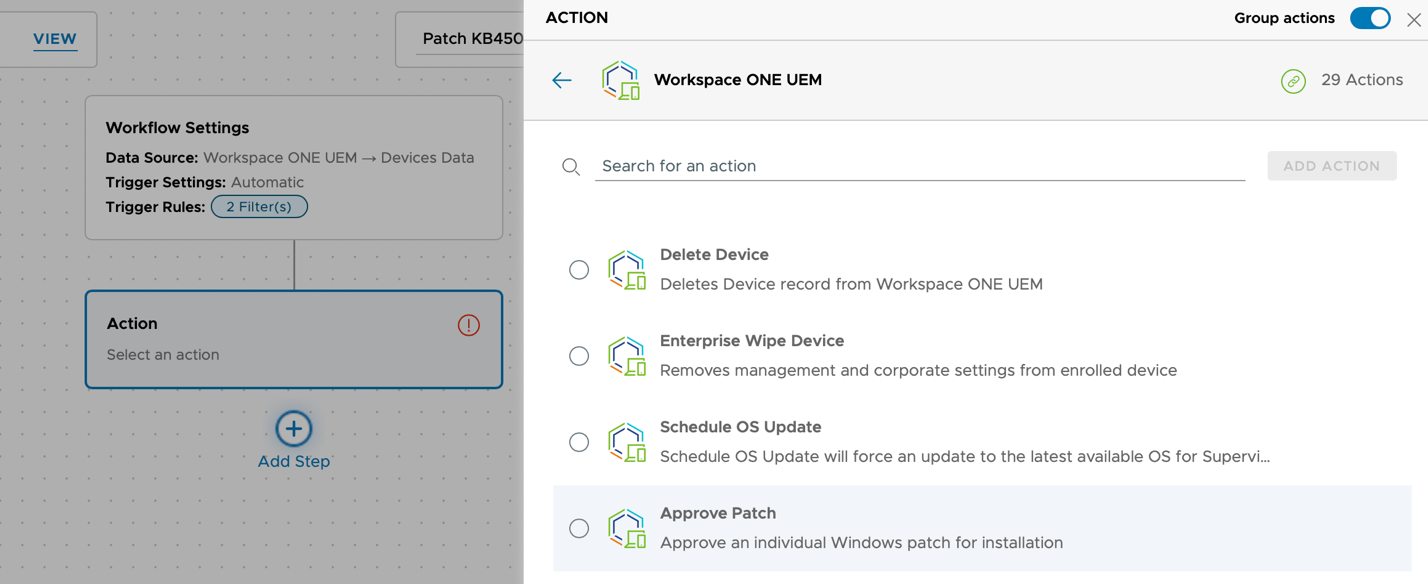
- Select Workspace ONE UEM
- Scroll down to the Action (Then) section, and click the + icon.
- Select Workspace ONE UEM from the available connections.
- Scroll down and select the Approve Patch action.
- Define Action Settings:
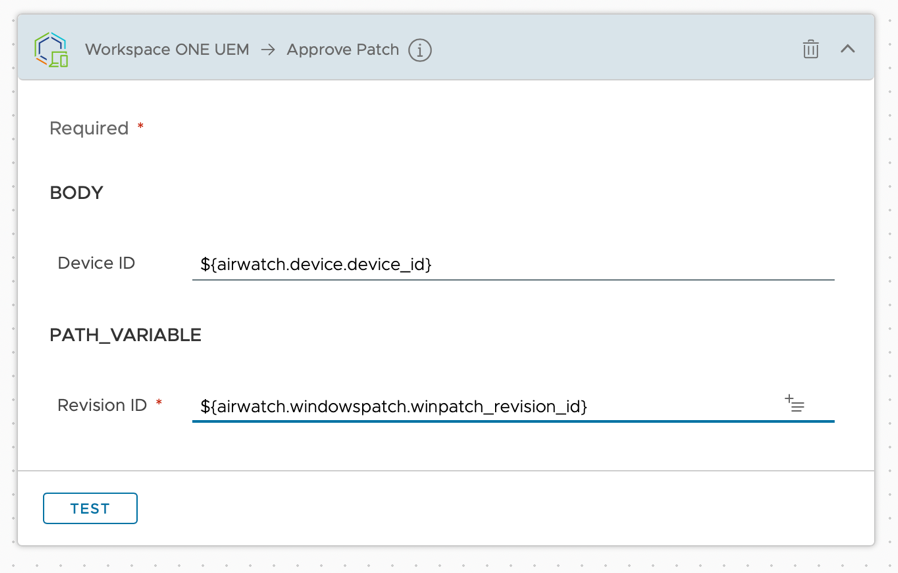
- For Revision ID, enter
${airwatch.windowspatch.winpatch_revision_id}. This will automatically assume the KB number from the filter condition. - Click the toggle to enable workflow.
- Click Save.
- Click Save & Enable.
- Confirm that your automation has been created and that it has a status of
Enabled.
Monitoring Patch Remediation
After you have enabled an action, you can monitor the potential impact and its execution in the Workspace ONE Intelligence console. In this activity, you walk through monitoring the patch remediation action you just created.
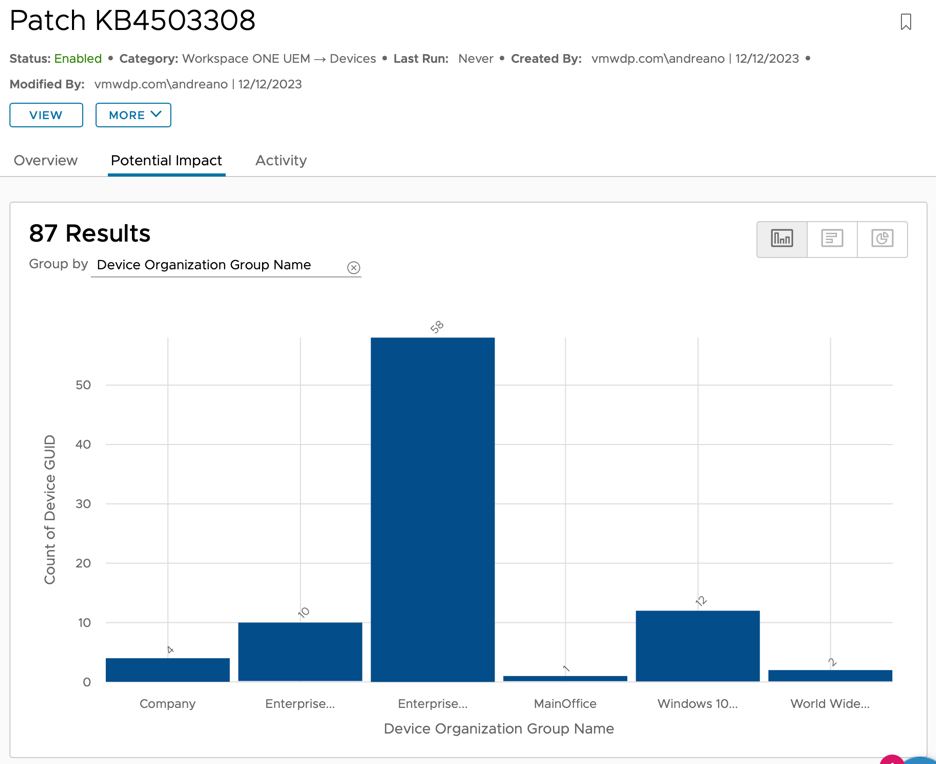
- To review the potential devices impacted, click on the Potential Impact for the workflow you just created.
- Select the Activity tab to monitor the execution of the workflow.
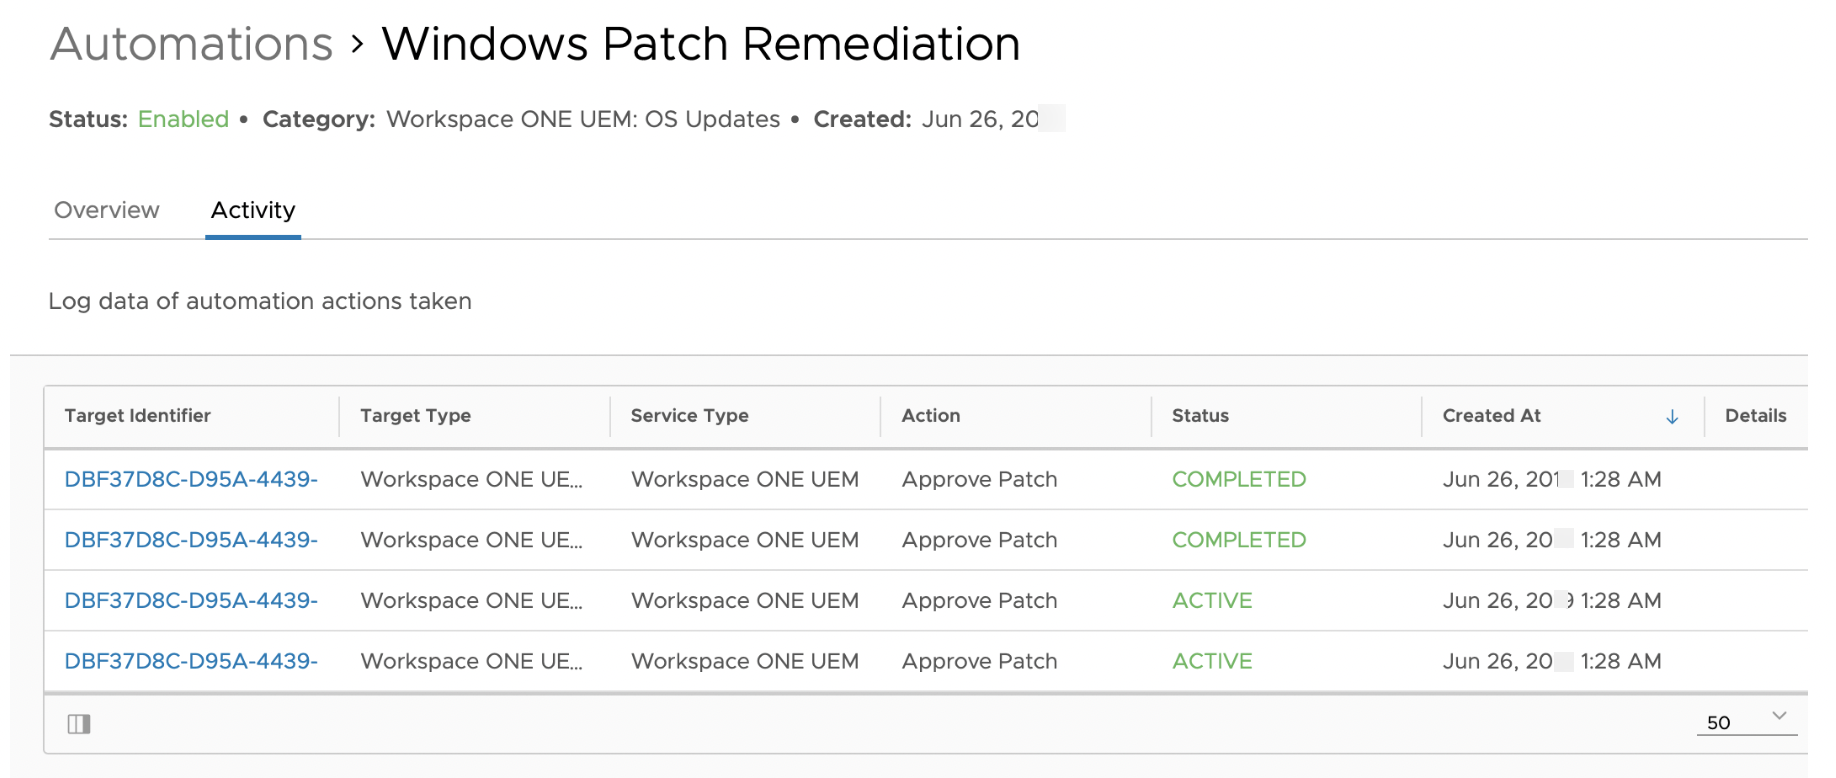
- Review the Activity logs - The activity list shows the log data of automation actions taken per OS update. You can click each Target Identifier link to obtain the device details on each action.
- Return to the Workspace ONE UEM console.
- On Workspace ONE UEM Console you can validate the patch status change triggered by the Workspace ONE Intelligence Automation.
- Click Devices.
- Click List View.
- Click the Device Name for your enrolled device.
- Validate patch approval status.
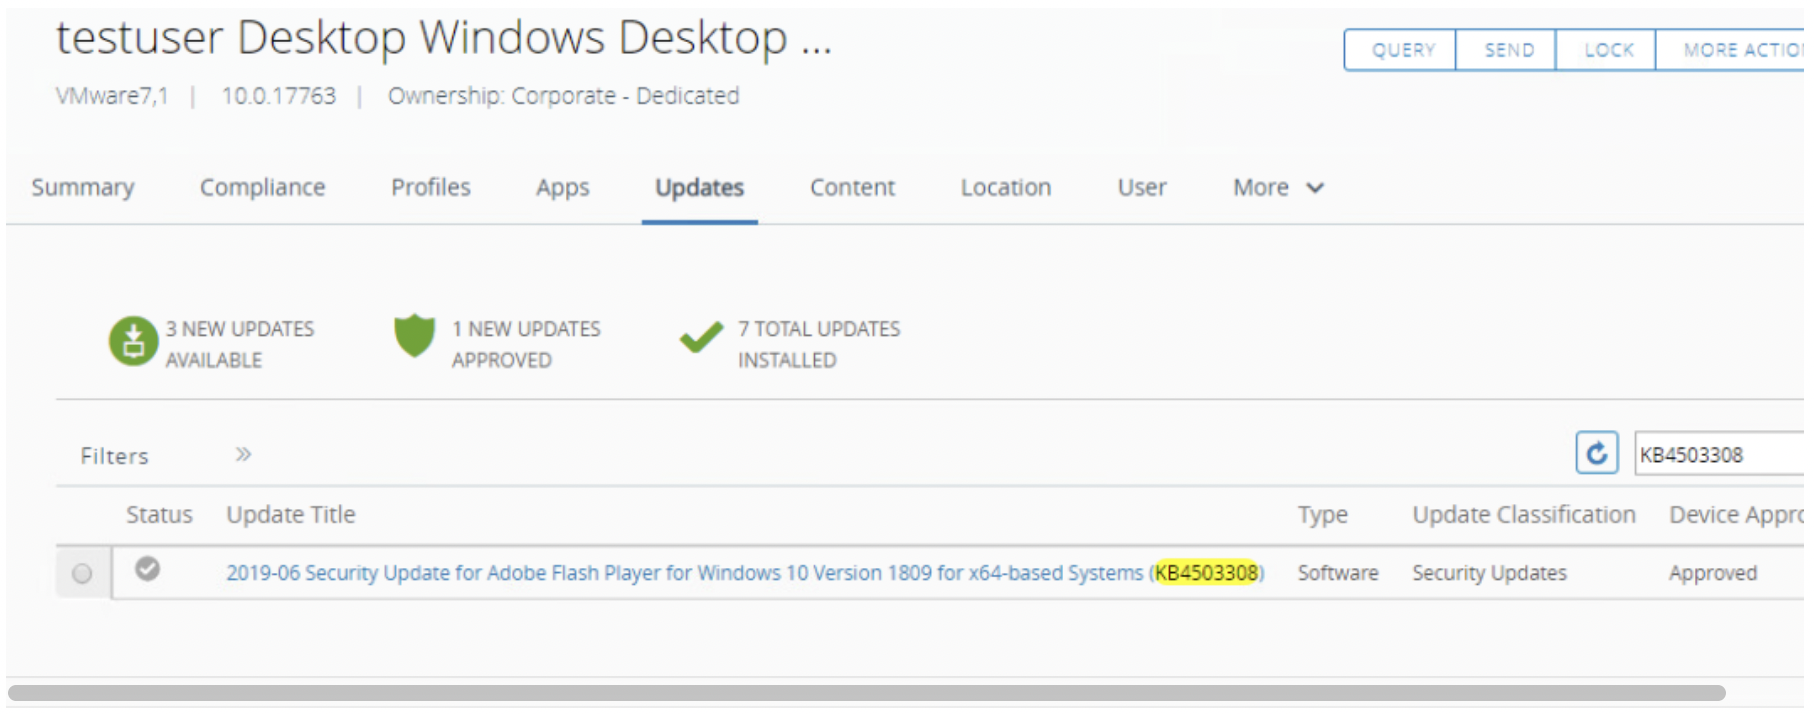
- Click Updates.
- Enter
KB4503308in the search box and press Enter. - Look for the
KB4503308, the status should be changed toApproved.
- Log in to the enrolled Windows device that just had a patch approved, and validate if the Windows Update is downloading.
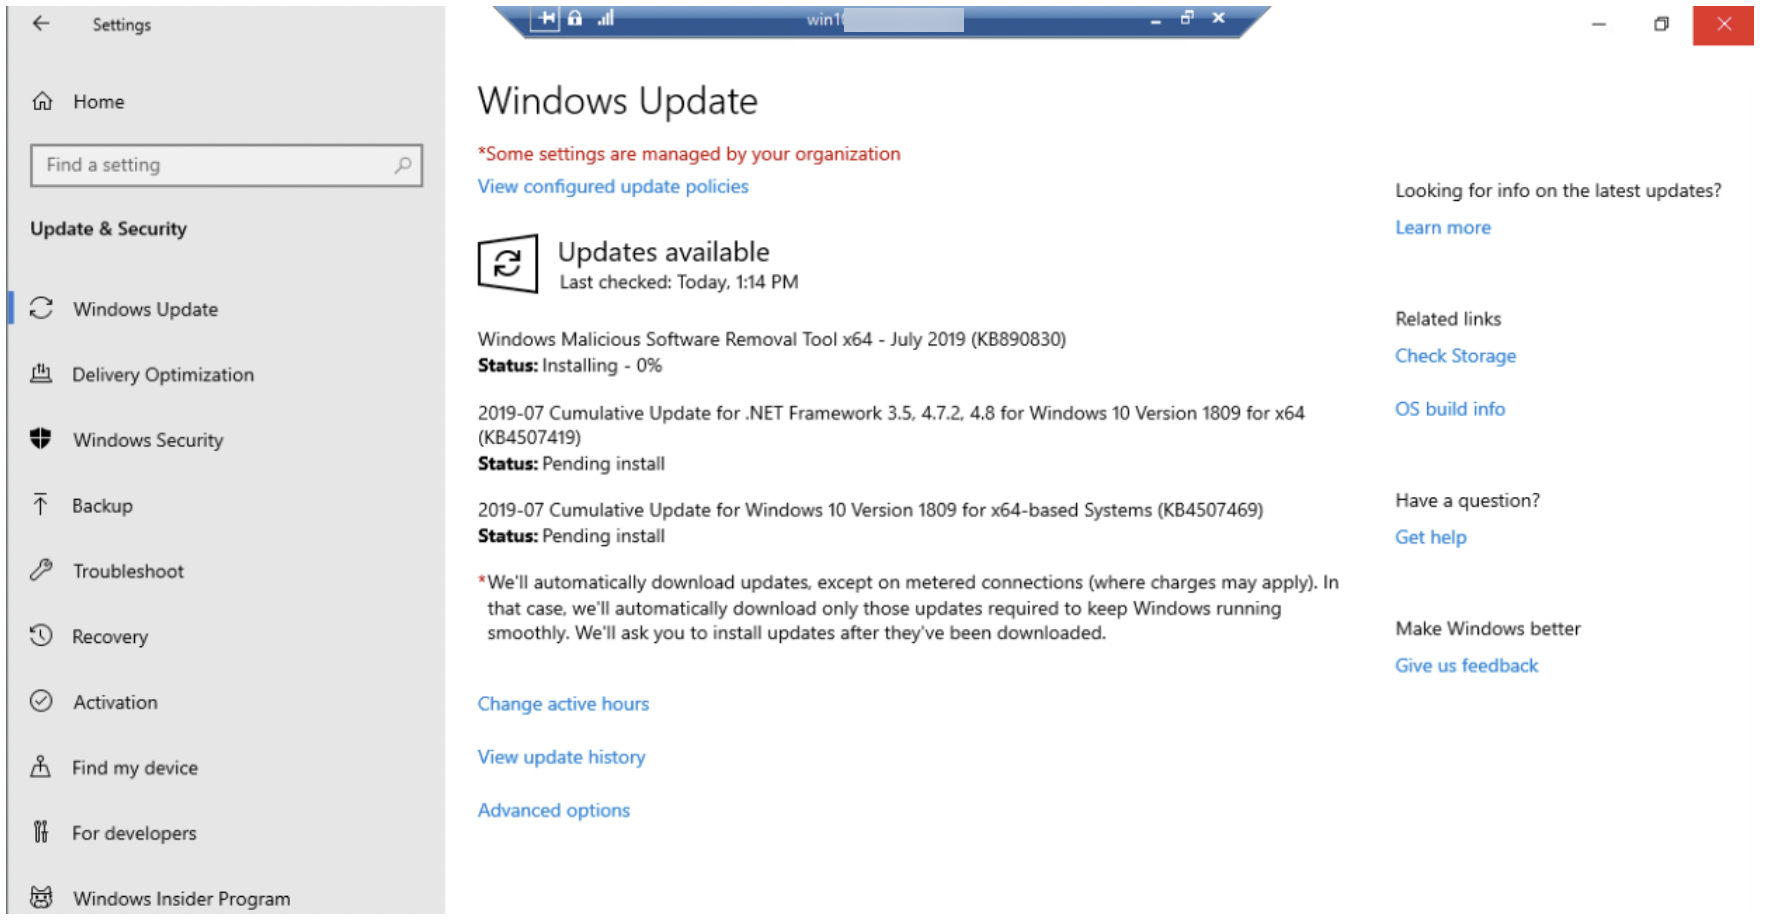
- Navigate to Windows Start > Settings > Update & Security.
- From Windows Update, you can follow the status (downloading, pending restart, installed) of all approved patches. Some patches might require a machine restart.
- Return to the Workspace ONE UEM console to force the device to check in and query the device OS updates data.
- Navigate to Devices > List View and select your Windows device.
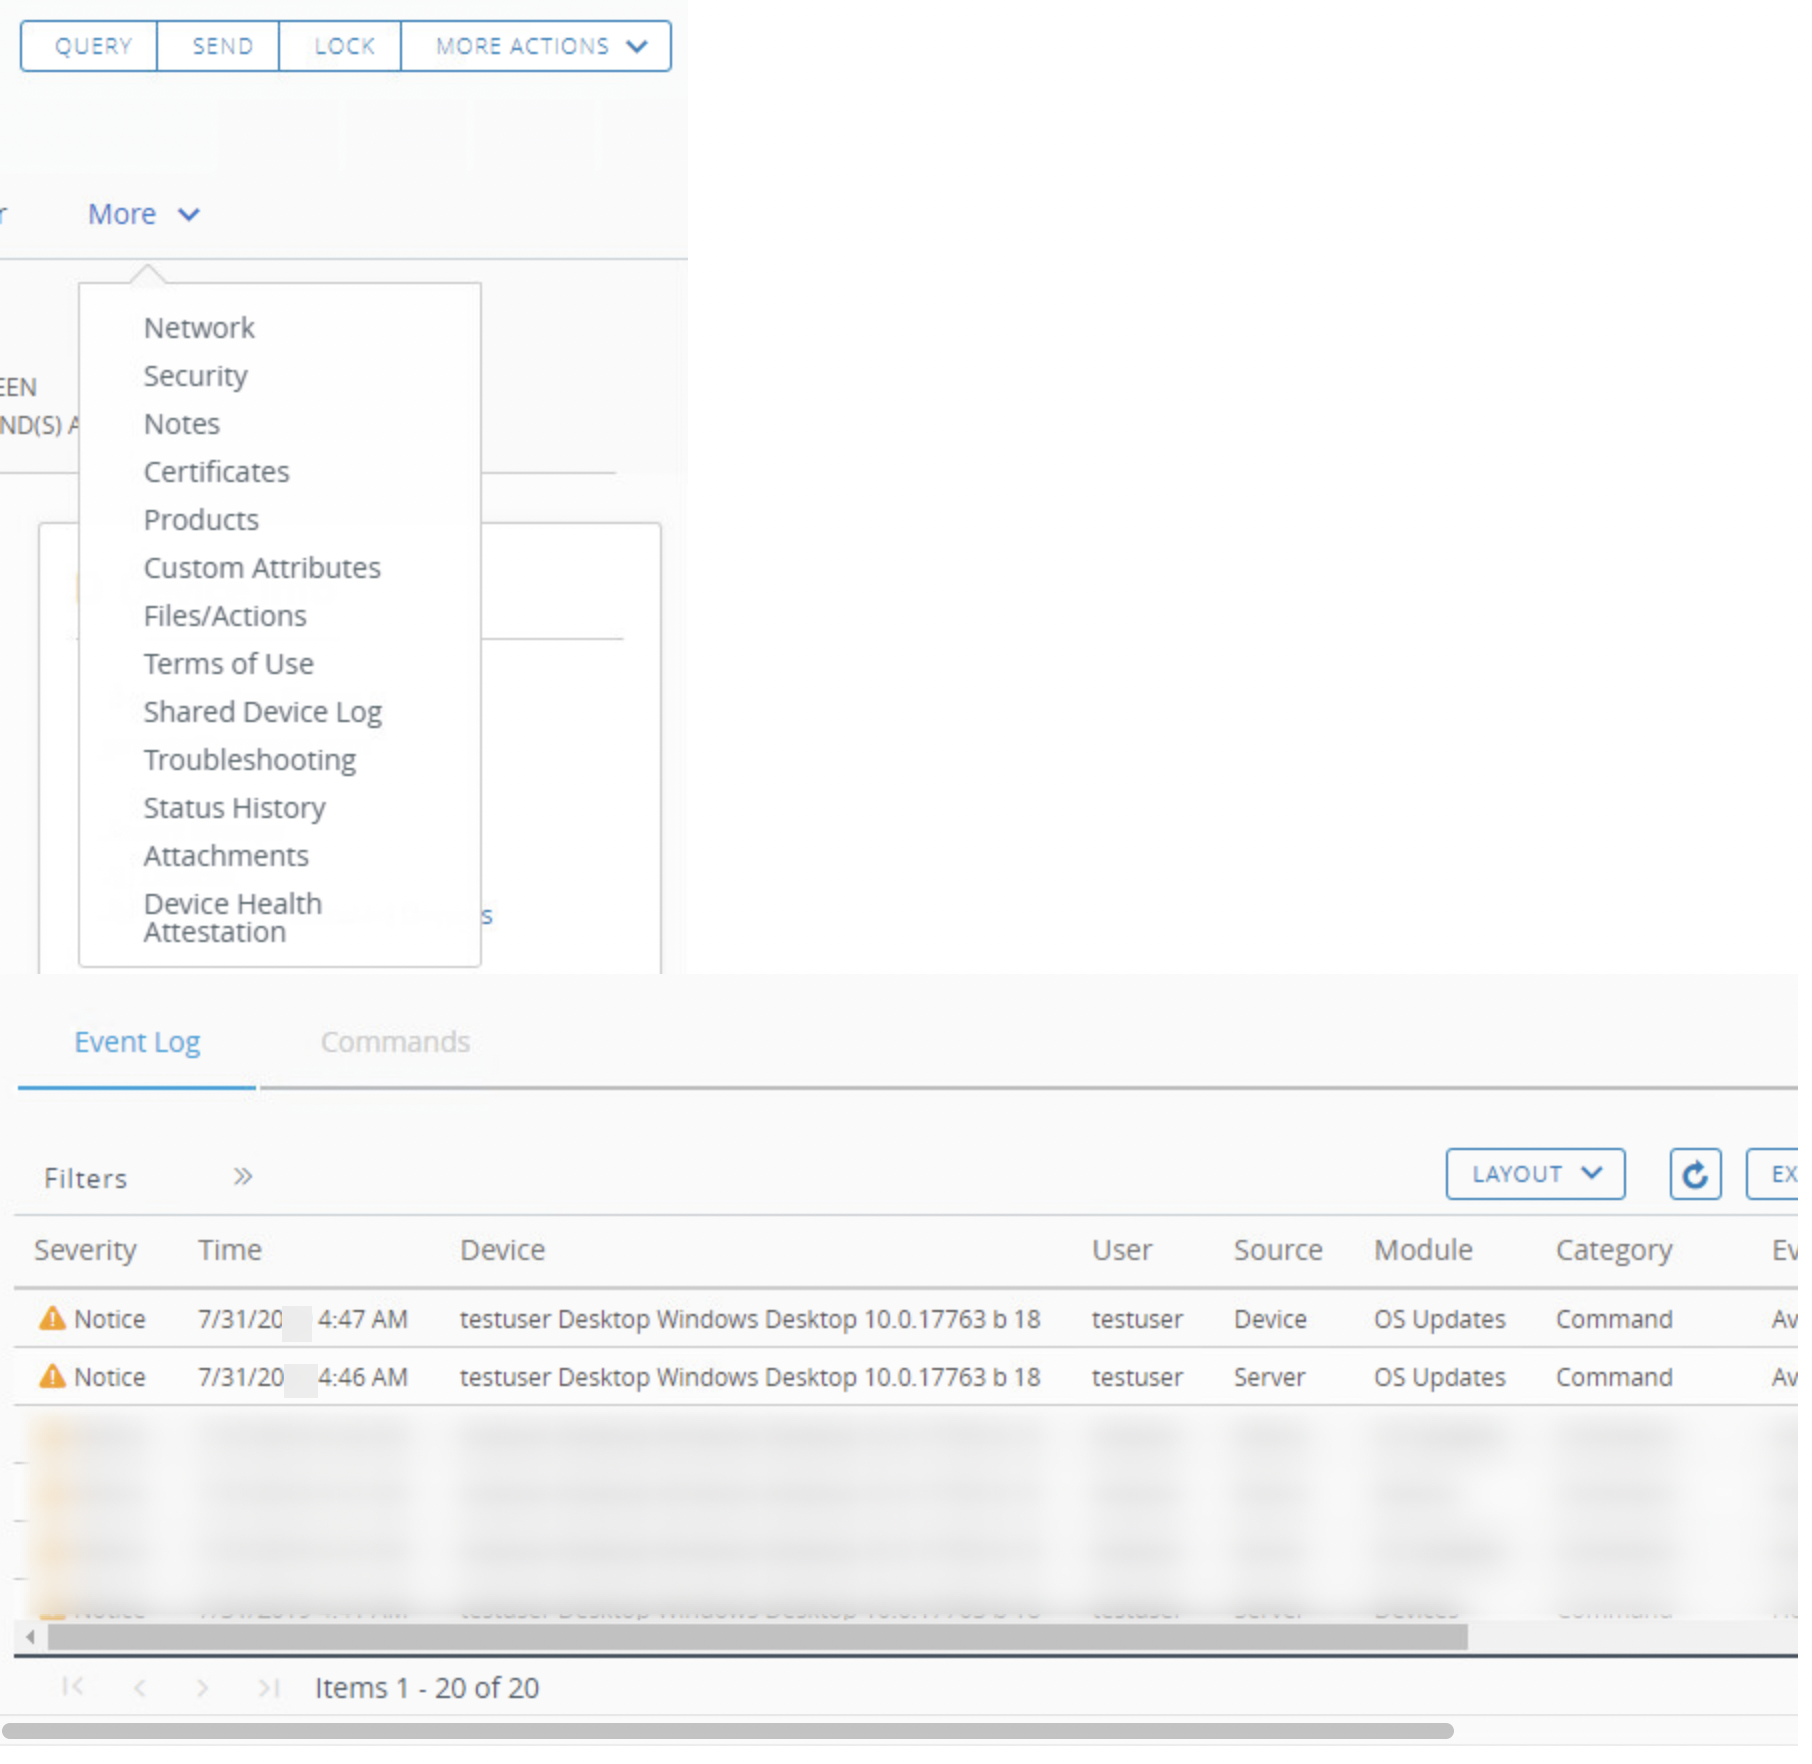
- Navigate to More Actions > OS Updates.
- To check the logs, navigate to More > Troubleshooting.
- You will see logs noting
Available OS Update requestedwhen the task is triggered, andAvailable OS Updates confirmedwhen the details are reported. - Click Refresh if needed to check the logs again for both events.
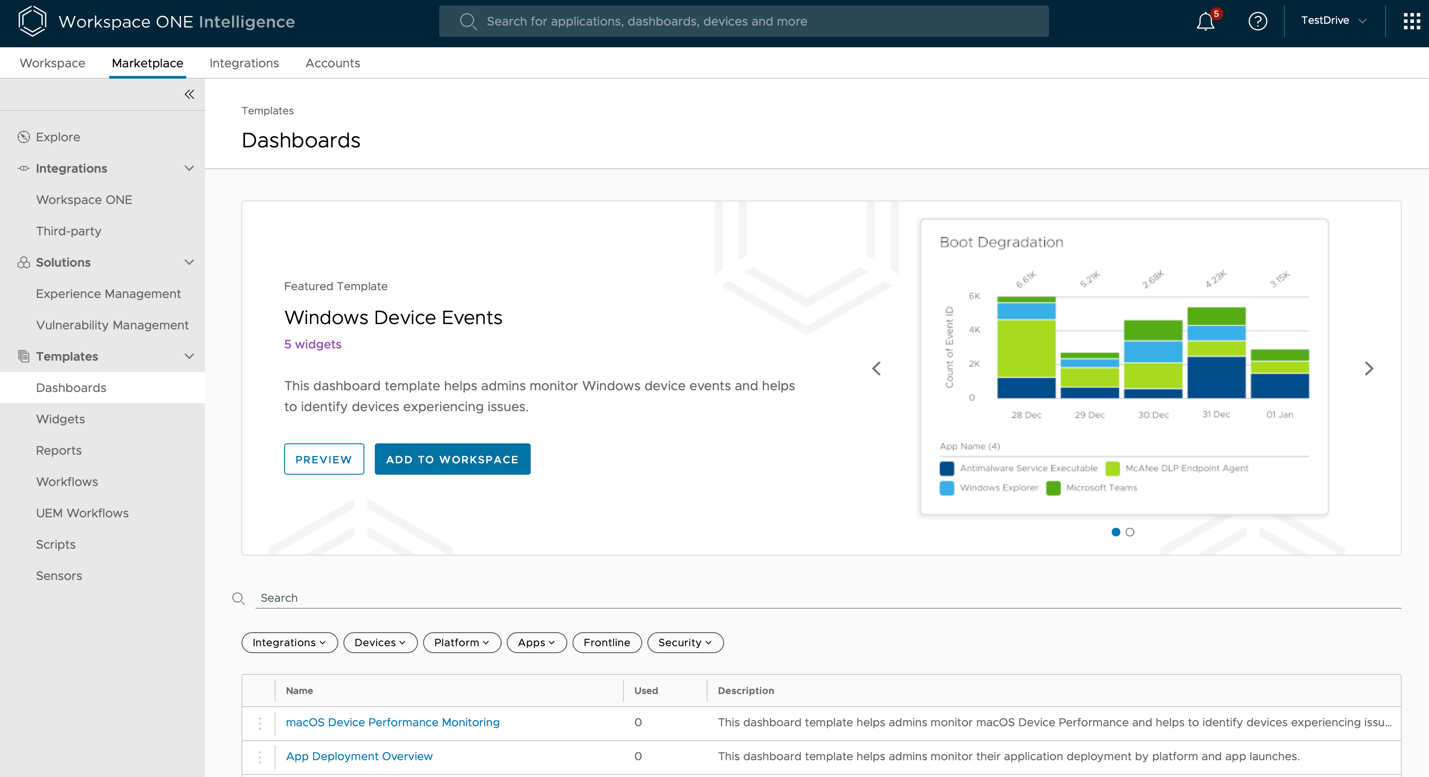
Out-of-the-box Templates (Marketplace)
The flexibility provided by Workspace ONE Intelligence makes possibilities endless, allowing administrators to create numerous types of dashboards, workflows, and reports based on their needs. Thinking about that, we decided to add a Marketplace to Workspace ONE, which is a repository of resources that allows our customers to share their ideas and how they are using the products through templates.
The Workspace ONE Marketplace provides a rich set of out-of-the-box content for the Workspace ONE admin, including solutions, templates, scripts, and other resources they can use to quickly address endpoint management, user experience, and workspace security use cases. This is a curated repository that is available to our customers to find in one place and to deploy easily with one click. Workspace ONE admins can leverage this content to speed up implementation and explore new use cases, IT tasks, and even complex business processes.
To access the Marketplace, click on Marketplace > Templates and navigate through the several templates organized by categories (Dashboards, Widgets, Reports, Workflows, etc.).
Use Cases
To learn more about other Workspace ONE Intelligence use cases, see the following articles, which go over several use cases implemented by our customers.
- Dashboards for IT Operations
- Automated Device Lifecycle Management
- Automated Remediation Process for Critical Resources
- Integration with your IT Service Management Tool
- Compliance Policy Engine (on Steroids)
- Vulnerability Management and Remediation
- Risk Analytics for Mobile Devices
- Integration with Mobile Threat Defense solutions (via Workspace ONE Trust Network)
- Tracking Mobile App User Experience through Mobile App Analytics
- Understanding User Sentiment through Micro Surveys
Summary and Additional Resources
This operational tutorial provided basic management steps for Workspace ONE Intelligence.
Procedures included:
- Getting started with Workspace ONE Intelligence.
- Using reports to gain insights.
- Using dashboards to visualize data and enforce device compliance.
- Automating patch remediation
Additional Resources
For more information about Workspace ONE, explore the Workspace ONE UEM Tech Zone Page. The activity path provides step-by-step guidance to help you level up in your Workspace ONE knowledge. You will find everything from beginner to advanced curated assets in the form of articles, videos, and labs.
Additionally, you can check out the Workspace ONE and Horizon Reference Architecture which provides a framework and guidance for architecting an integrated digital workspace using Workspace ONE and Horizon.
Changelog
The following updates were made to this guide:
| Date | Description of Changes |
| 2023/12/12 |
|
| 2022/03/22 |
|
About the Author
This tutorial was written by:
- Andreano Lanusse, End-User-Computing Staff Architect, Technical Marketing, VMware.
Feedback
Your feedback is valuable.
To comment on this paper, contact VMware End-User-Computing Technical Marketing at euc_tech_content_feedback@vmware.com.