
Smarter Analytics with Workspace ONE Intelligence for Horizon
Monitoring a Horizon solution can be tricky with the number of factors; the more distributed the end user pool, the more variables there are to track. In this blog series, we are going to look at the newly released Workspace ONE Intelligence for Horizon and how it can help solve some common challenges with monitoring virtual desktops and apps.
First up in our series, let’s take a look at Workspace ONE Intelligence’s Horizon Monitoring solution and how it can help solve problems at any scale.
Why a monitoring solution in the cloud?
Let me answer this first question with a quick story.
Before my VMware days, I was a systems administrator for a law firm that covered the Mountain West region of the United States, a massive territory, with our main office in Denver, Colorado (where all the IT staff was located) and two satellite offices in Cheyenne, Wyoming and Billings, Montana.
Attorneys all had laptops and accessed client files remotely via RDS-hosted desktops from courthouses, client locations, and satellite offices when they needed them, and when a problem came up, getting them a solution to get their data in that location became a huge challenge; you can’t just ask someone in a trial to run some network tests to see if their connection is stable.
The challenge for me back then was the locations of the tools to investigate problems, all of which were in our main office. The data was local to each office and contained on each RDS host: logs of the users, the protocol traffic, resource monitors, and event logs. To start investigating the problem, you had to establish a connection to the correct environment. If, in the end, the issue was on the user’s side? Often, someone had to get in the car and go fix it, which in the western United States is potentially 551 miles / 887 km from Denver to Billings: at highway speeds that’s an 8-hour trip.
Centralized monitoring, available anywhere
A cloud-based monitoring solution would have been my nirvana back in my law firm days. Simply put, you have a central location to be able to quickly drill down into issues and trends within your environment, available anywhere, which means you won’t need to connect to a resource at the correct location to start investigating. Workspace ONE Intelligence for Horizon would have been the magic bullet for the past me.
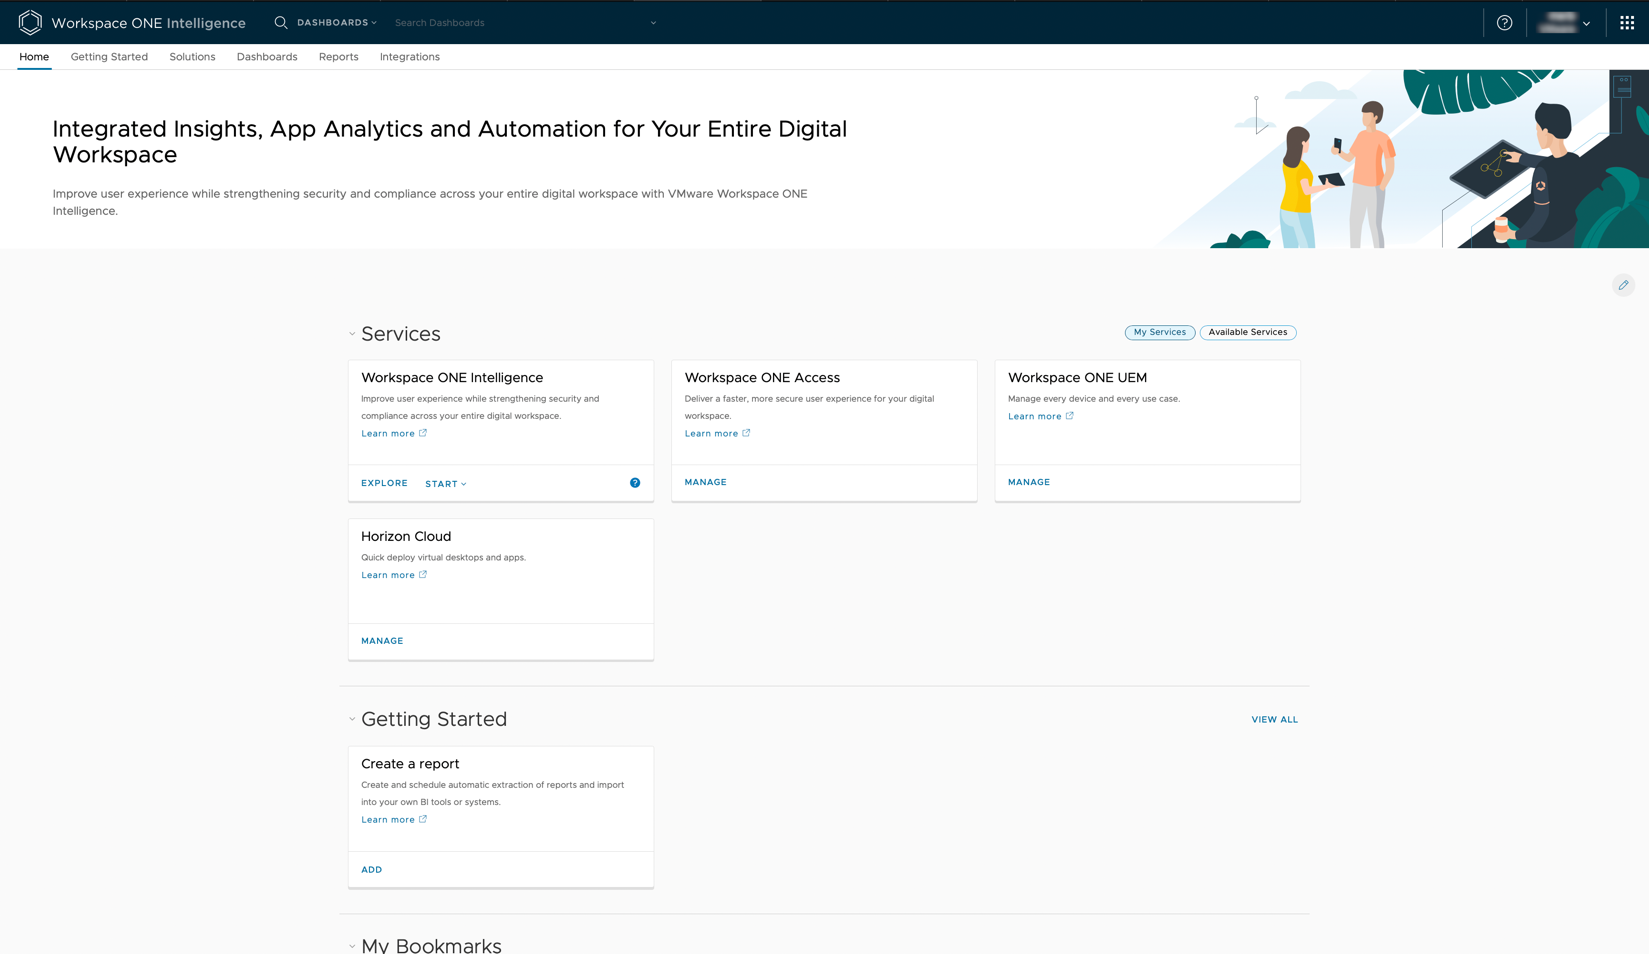
Figure 1: Workspace ONE Intelligence with Horizon Cloud
Workspace ONE Intelligence for Horizon is available with several subscription licenses:
- Horizon Universal Subscription
- Horizon Apps Universal
- Horizon Apps Standard
Another important factor to consider, if you currently or plan to use Workspace ONE UEM as part of your deployment: for enrolled client devices (which I should add can include any Horizon full clone desktops in use!), you have one platform for monitoring both the end user’s device as well as their virtual desktops and apps.
Troubleshooting with Intelligence
Let’s take a first look into some of the predefined dashboards available and how we can quickly use them to identify trends and issues in the environment. For this scenario, we are going to look through the lens for troubleshooting slow logons, a seemingly trivial but costly issue. The root cause for such can vary between something as simple as a huge user profile to as esoteric as a cosmic ray hitting just right to flip the wrong bit.

Figure 2: Intelligence for Horizon dashboard overview showing deployment locations
The top-level dashboard for the solution provides some quick metrics to gauge the overall health of the deployment, and the ability to drill down into specific metrics or details as needed. Here, we can filter through the environment from several different angles with the dashboards in Figure 3 updating to give you details specific to your selections.

Figure 3: Drilling down into the physical location of resources.
Our fictitious user is in India, so in this case, we are going to filter by location to select resources only from the India location. If you’d rather, you can narrow results by the logical Horizon constructs: deployments (on private or cloud SDDCs), pods, or directly to the pool level. As a note, if you have more than one deployment per location, a screen will allow you to narrow the results.
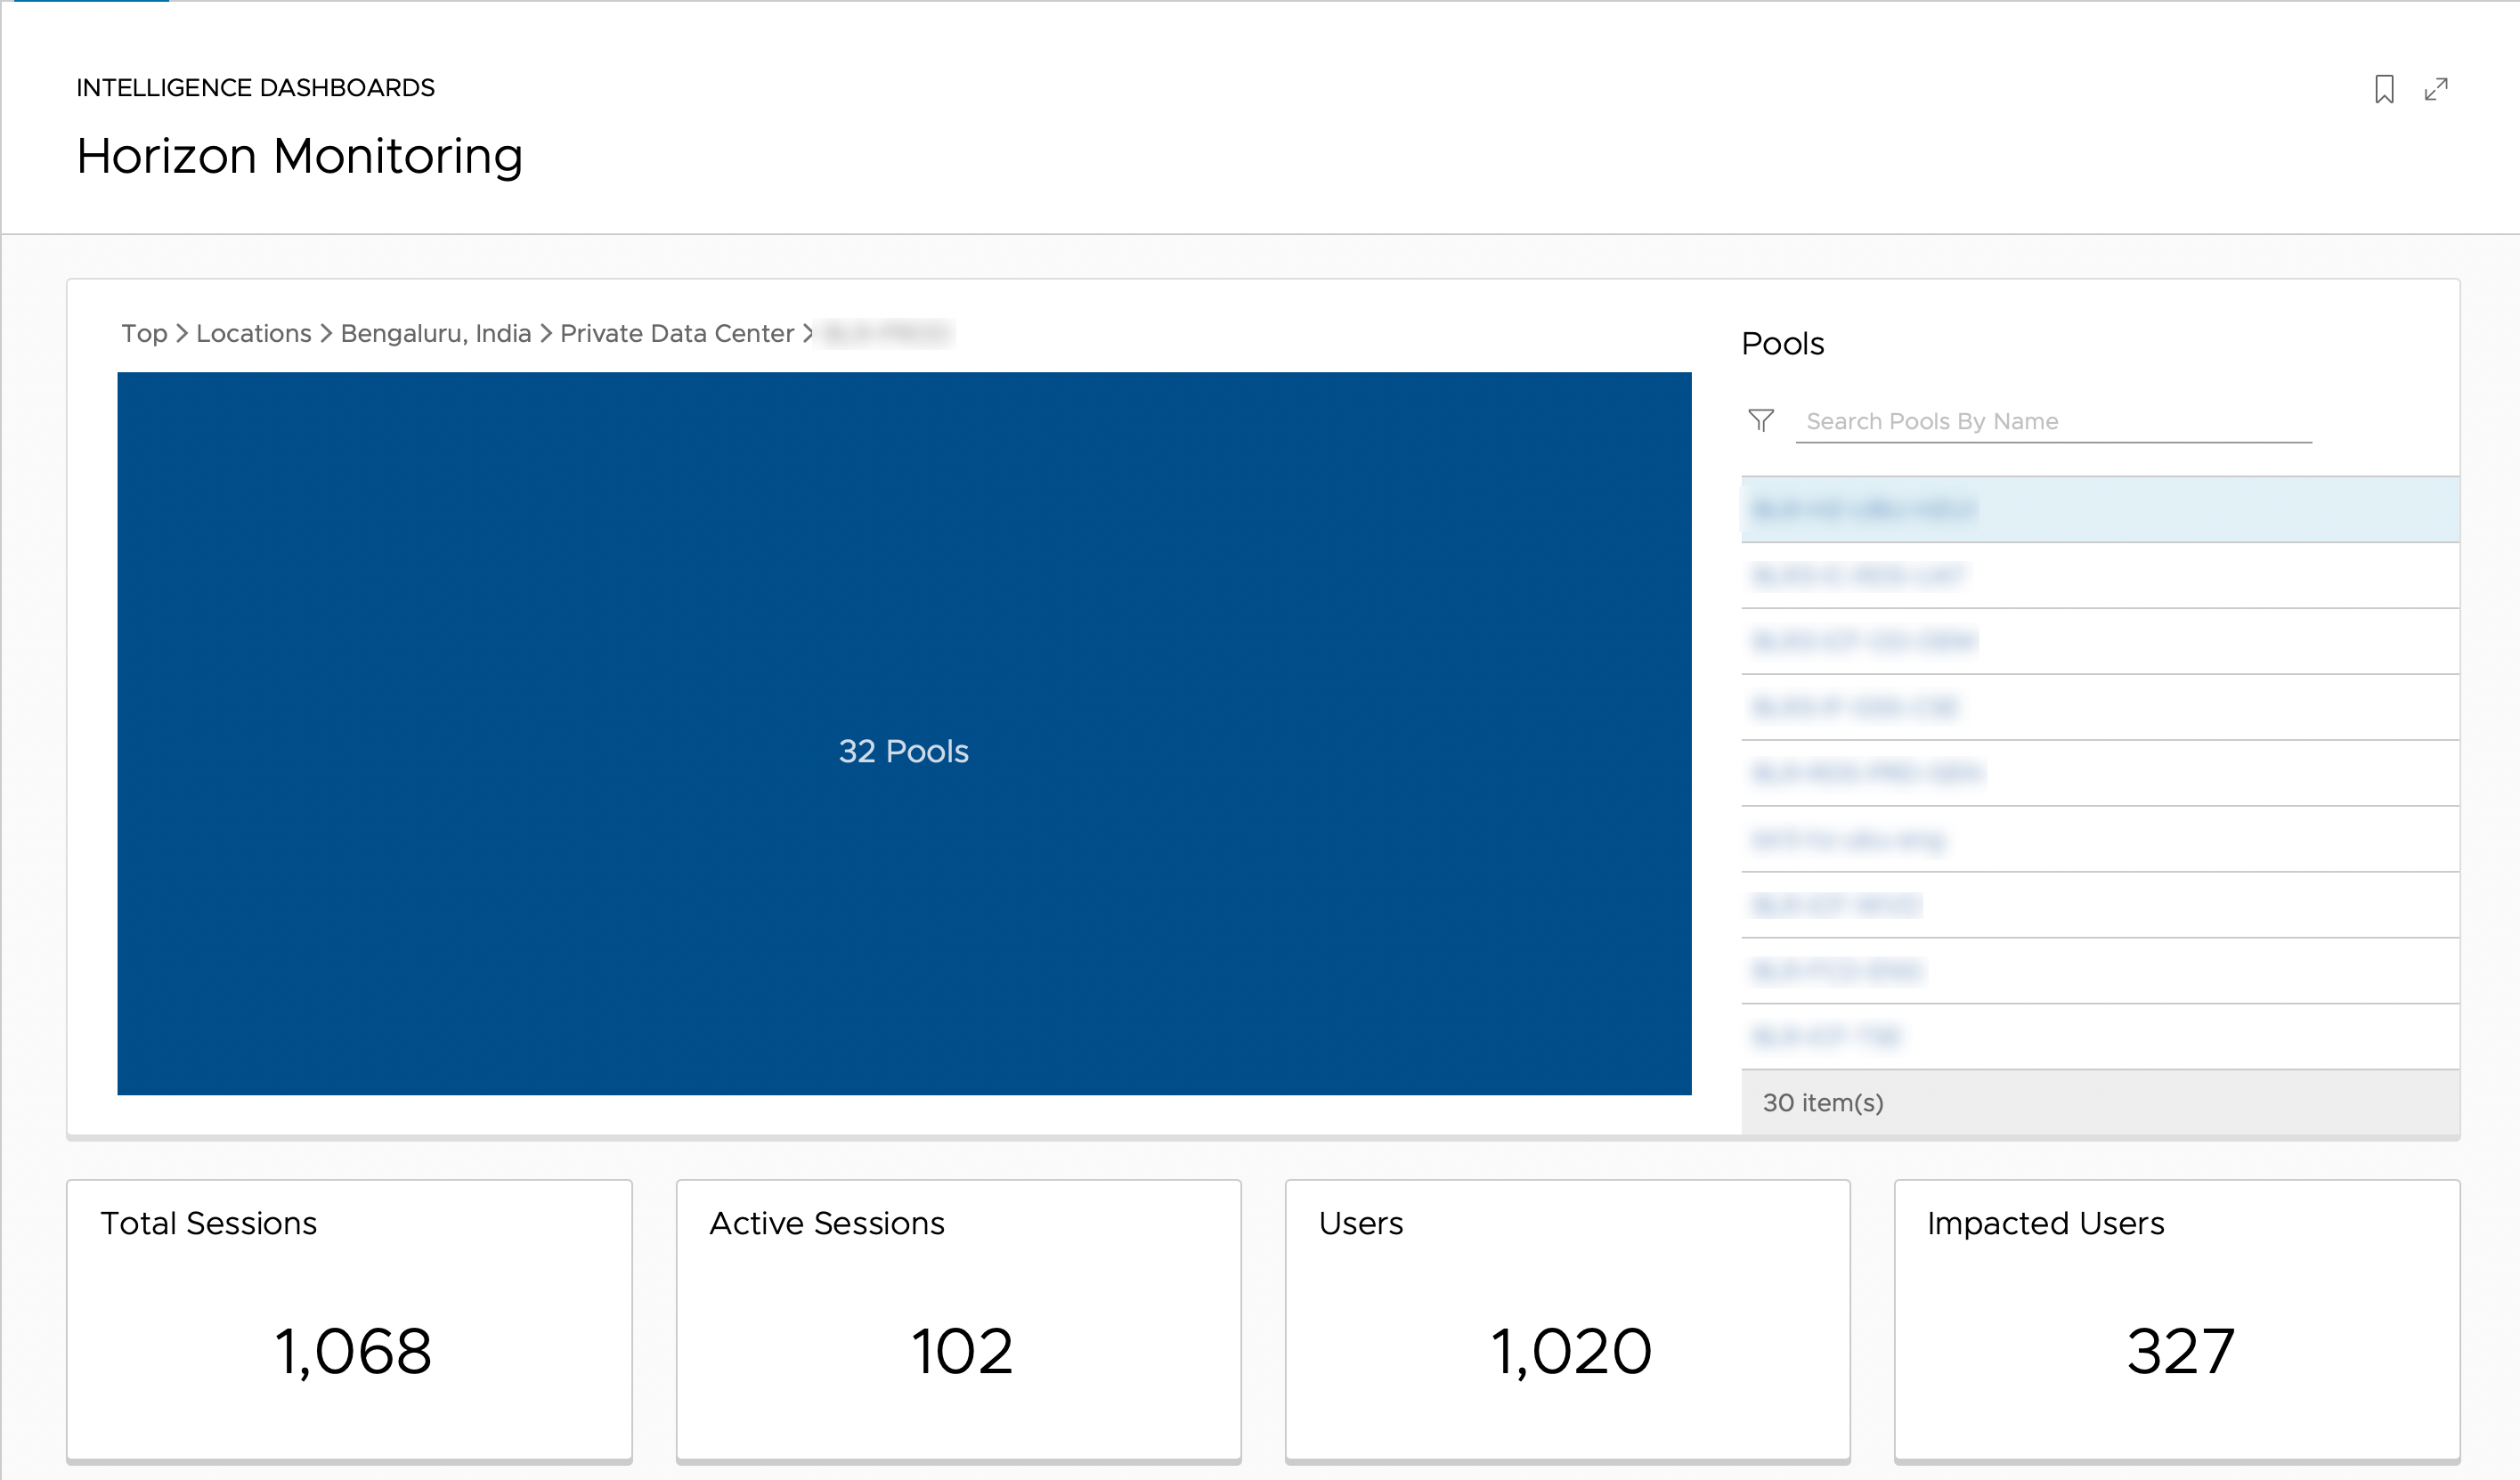
Figure 3: Drilling down into the physical location of resources
Drilling down into the location, in this case, our Bengaluru, India SDDC and respective pod, we’re given a list of all available pools to get specific metrics from as well as a summary of the overall sessions. You can either drill down into specifics for the entire pod here, or you can select an individual pool to narrow the results.

Figure 4: Pool level details for resource utilization and key metrics.
At the pool level, we get our first glimpse of a potential issue. Our physical resources all look fine, a couple of machines have higher than normal memory usage, but that isn’t a problem by itself. Our Blast latency also looks great, a couple of sessions are higher than normal, but nothing too out of the ordinary. Looking at our logon durations, however, we can see that there are a fairly large number of sessions that took longer than normal to log in.

Figure 5: Logon information for the selected pool
Lastly, let’s move into the detail view for the pool’s Logon Duration metric. Here, we can see that some of our users have longer than average timings between Windows registering the logon even to the shell start. We can see that the shell load time is fine for the users in view, the profile load times are consistent with users not having issues, and that the interactive times are all on the lower end.
Just like that we’ve ruled out several major potential causes for slow logons: the compute is healthy so it’s not slowing us down, there aren’t issues with the protocol latency causing a delay, and the sub-components of the logon process that Windows tracks are consistent between users.
What’s Next?
That wraps up this quick intro and example of how Workspace ONE Intelligence for Horizon can quickly show value out of the box. In our next installment, we will look at custom dashboards and the process of creating them.
Check out the release announcement: Introducing VMware Workspace ONE Intelligence for Horizon.
For information on how to integrate your Horizon deployment with Workspace ONE Intelligence, see the VMware Horizon Integration section of the Workspace ONE documentation.