
Workspace ONE Intelligence Architecture
This chapter is one of a series that make up the VMware Workspace ONE and VMware Horizon Reference Architecture, a framework that provides guidance on the architecture, design considerations, and deployment of Workspace ONE and Horizon solutions. This chapter provides information about architecting VMware Workspace ONE Intelligence.
Introduction
The shift from traditional mobile device management (MDM) and PC management to a digital workspace presents its own challenges.
- Data overload – When incorporating identity into device management, IT departments are deluged by an overwhelming volume of data from numerous sources.
- Visibility silos – From a visibility and management standpoint, working with multiple unintegrated modules and solutions often results in security silos.
- Manual processes – Traditional approaches such as using spreadsheets and scripting create bottlenecks and require constant monitoring and corrections.
- Reactive approach – The process of first examining data for security vulnerabilities and then finding solutions can introduce delays. These delays significantly reduce the effectiveness of the solution. A reactive approach is not the best long-term strategy.
VMware Workspace ONE® Intelligence™ is designed to simplify user experience without compromising security. The intelligence service aggregates and correlates data from multiple sources to give complete visibility into the entire environment. It produces the insights and data that will allow you to make the right decisions for your VMware Workspace ONE® deployment. Workspace ONE Intelligence has a built-in automation engine that can create rules to take automatic action on security issues.
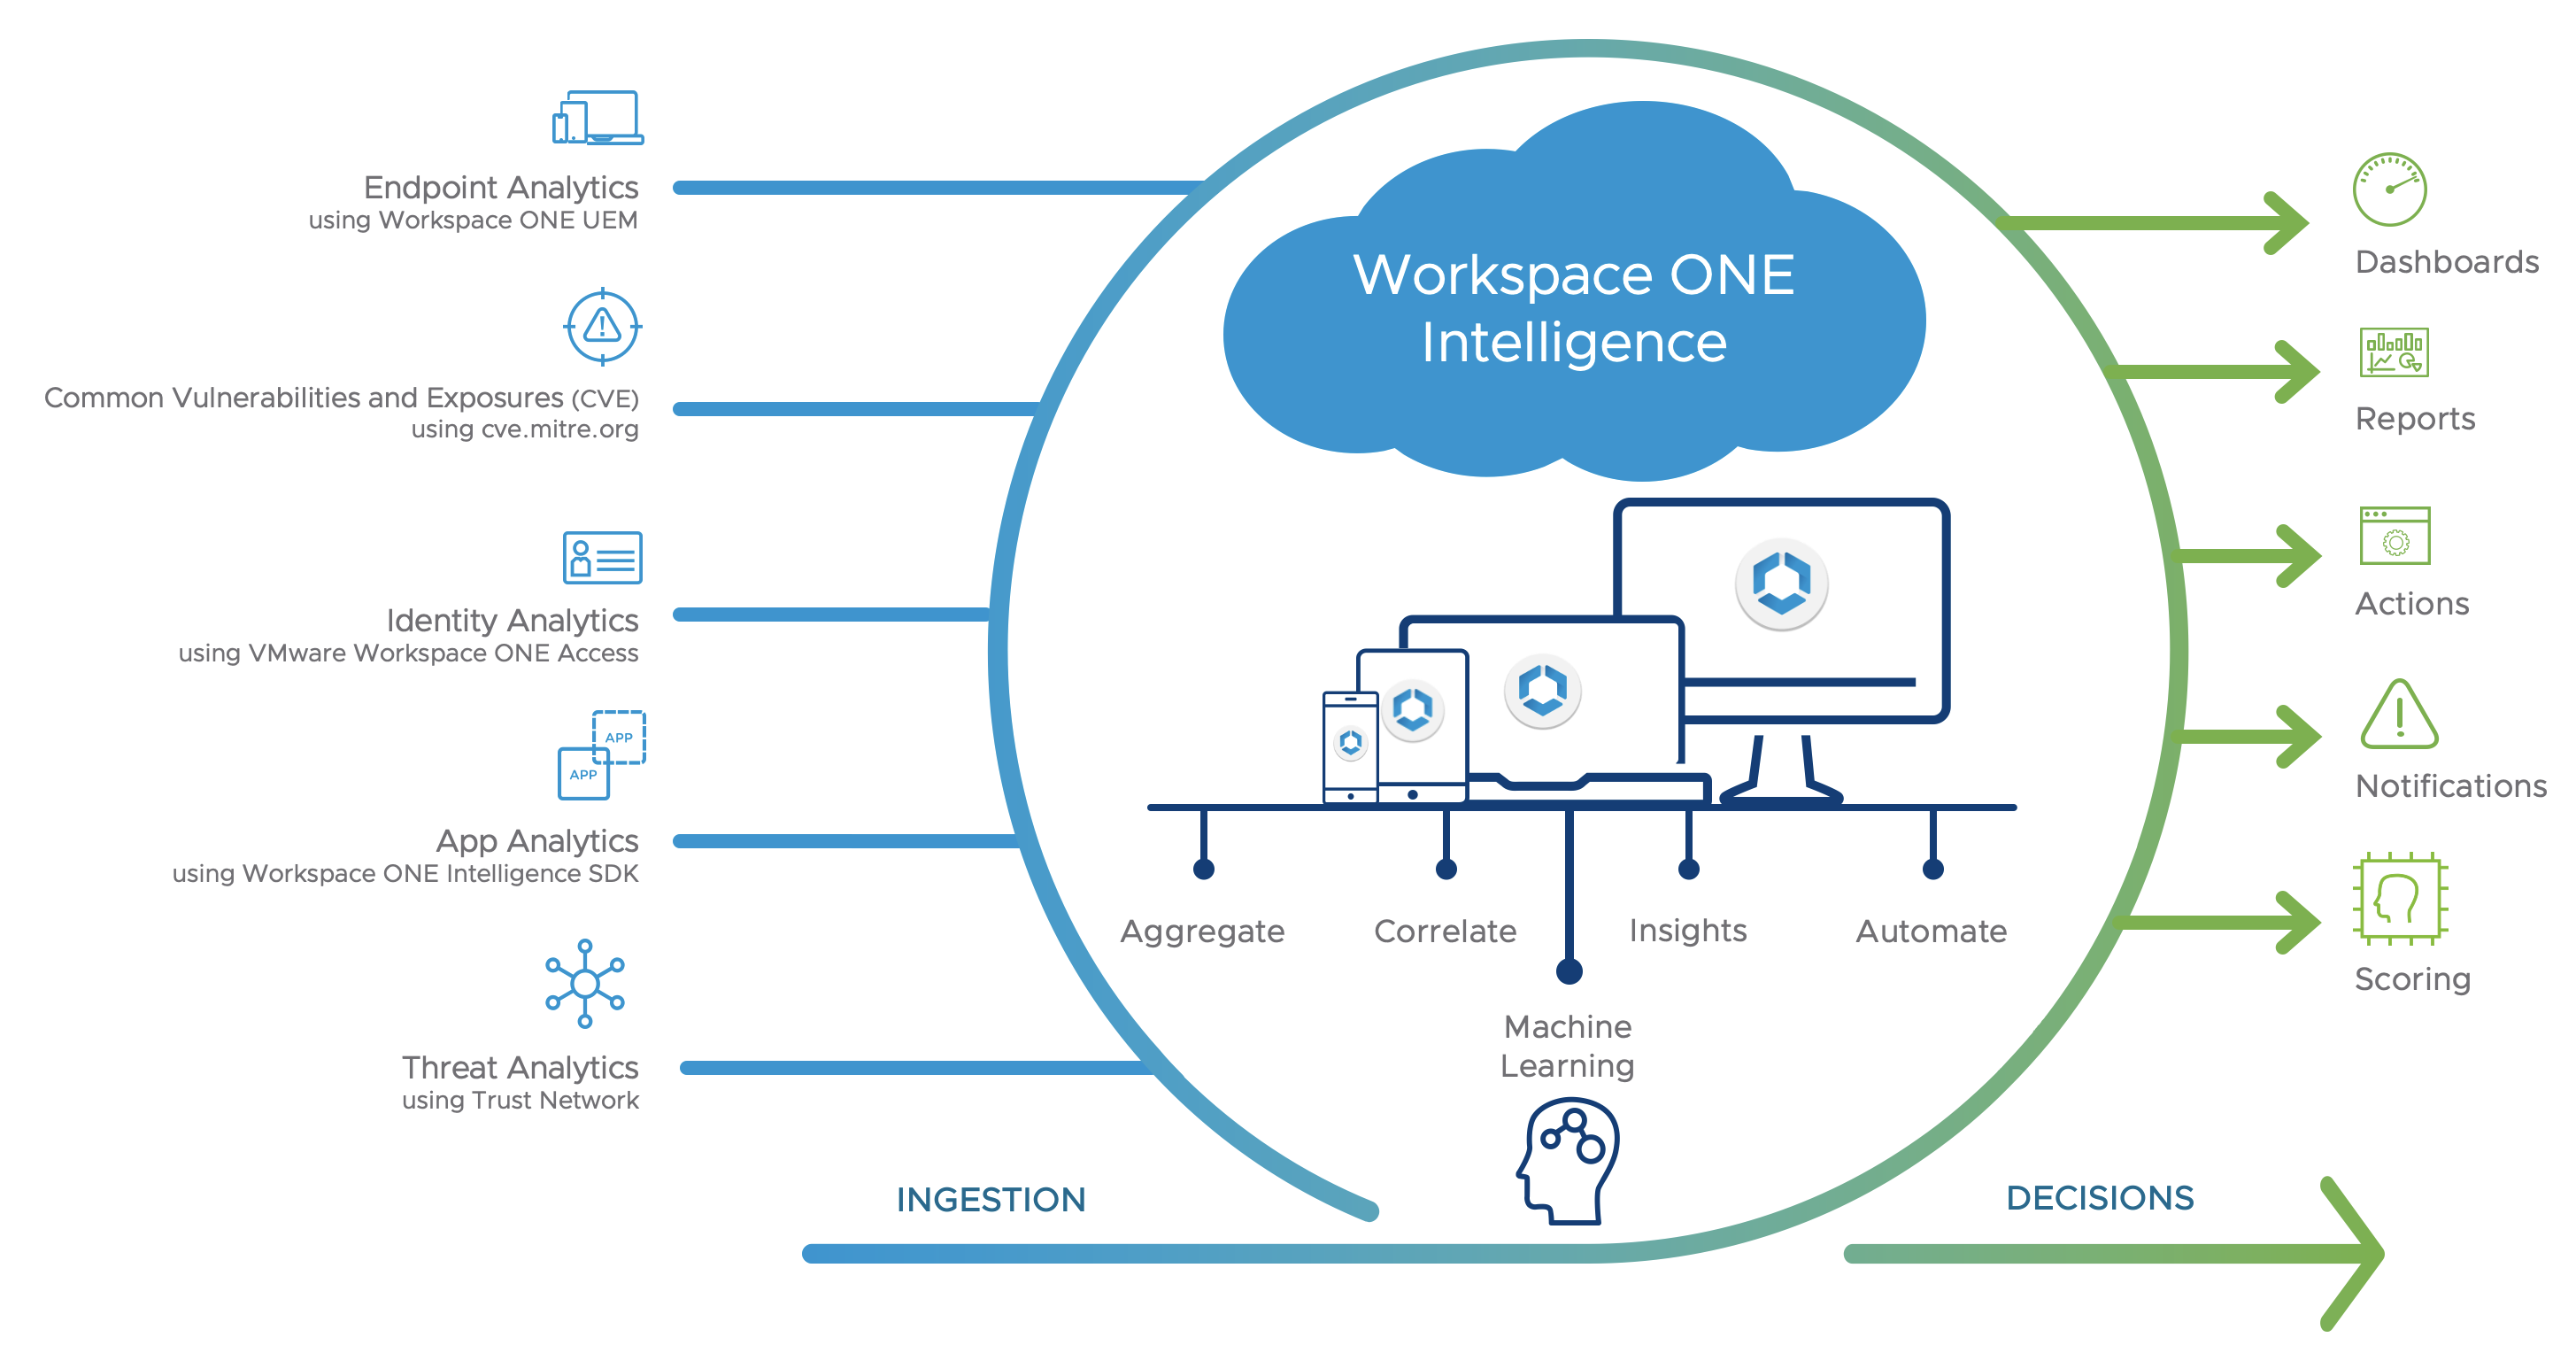
Figure 1: Workspace ONE Intelligence Logical Overview
Table 1: Implementation Strategy for Workspace ONE Intelligence
| Decision | Workspace ONE Intelligence was implemented. |
| Justification | The intelligence service aggregates and correlates data from multiple sources to optimize resources and strengthen security and compliance across the entire digital workspace. |
Architecture
Workspace ONE Intelligence is a cloud-only service, hosted on Amazon Web Services (AWS), that offers the following advantages:
- Reduces the overhead of infrastructure and network management, which allows users to focus on utilizing the product.
- Complements the continuous integration and continuous delivery approach to software development, allowing new features and functionality to be released with greater speed and frequency.
- Helps with solution delivery by maintaining only one version of the software without any patching.
- AWS are industry leaders in cloud infrastructure, with a global footprint that enables the service to be hosted in different regions around the world.
- AWS offers a variety of managed services out-of-the-box for high availability and easy monitoring.
- Leveraging these services allows VMware to focus on product feature development and security rather than infrastructure management.
Workspace ONE Intelligence includes the following components.
Table 2: Components of Workspace ONE Intelligence
| Component | Description |
| Workspace ONE Intelligence Connector | An ETL (Extract, Transform, Load) service responsible for collecting data from the Workspace ONE database and feeding it to the Workspace ONE Intelligence cloud service. |
| Intelligence Cloud Service | Aggregates all the data received from an Intelligence Connector and generates and schedules reports. Populates the Workspace ONE Intelligence dashboard with different data points, in the format of your choice. |
| Consoles | Workspace ONE Intelligence currently leverages two consoles:
|
| Data sources | VMware Workspace ONE® UEM, Workspace ONE Access™, Workspace ONE Intelligence SDK, Common Vulnerability and Exposures (CVE), and Workspace ONE Trust Network. |
Scalability and Availability
The Workspace ONE Intelligence service is currently hosted in six production regions, including Oregon (two locations), Ireland, Frankfurt, Tokyo, and Sydney. It leverages the same auto-scaling and availability principles as those described in AWS Auto Scaling and High Availability (Multi-AZ) for Amazon RDS.
Database
Workspace ONE Intelligence uses a variety of databases, depending on the data type and purpose. These databases are preconfigured, offered out-of-the-box as per the cloud service offering, and no additional configuration is necessary.
Table 3: Workspace ONE Intelligence Databases
| Database Type | Description |
| Amazon S3 | Ultimate source of truth Cold storage for all data required for database recovery if needed Also used actively for scenarios such as app analytics loads and usage |
| Dynamo DB | Managed service of AWS Stores arbitrary key-value pairs for different data types Data resource for reports for dashboard and subscriptions |
| Elasticsearch – History | Historical charts Historical graphs |
| Elasticsearch – Snapshot | Report previews Current counts |
Data Sources
The following figure shows how the various data sources contribute to Workspace ONE Intelligence.
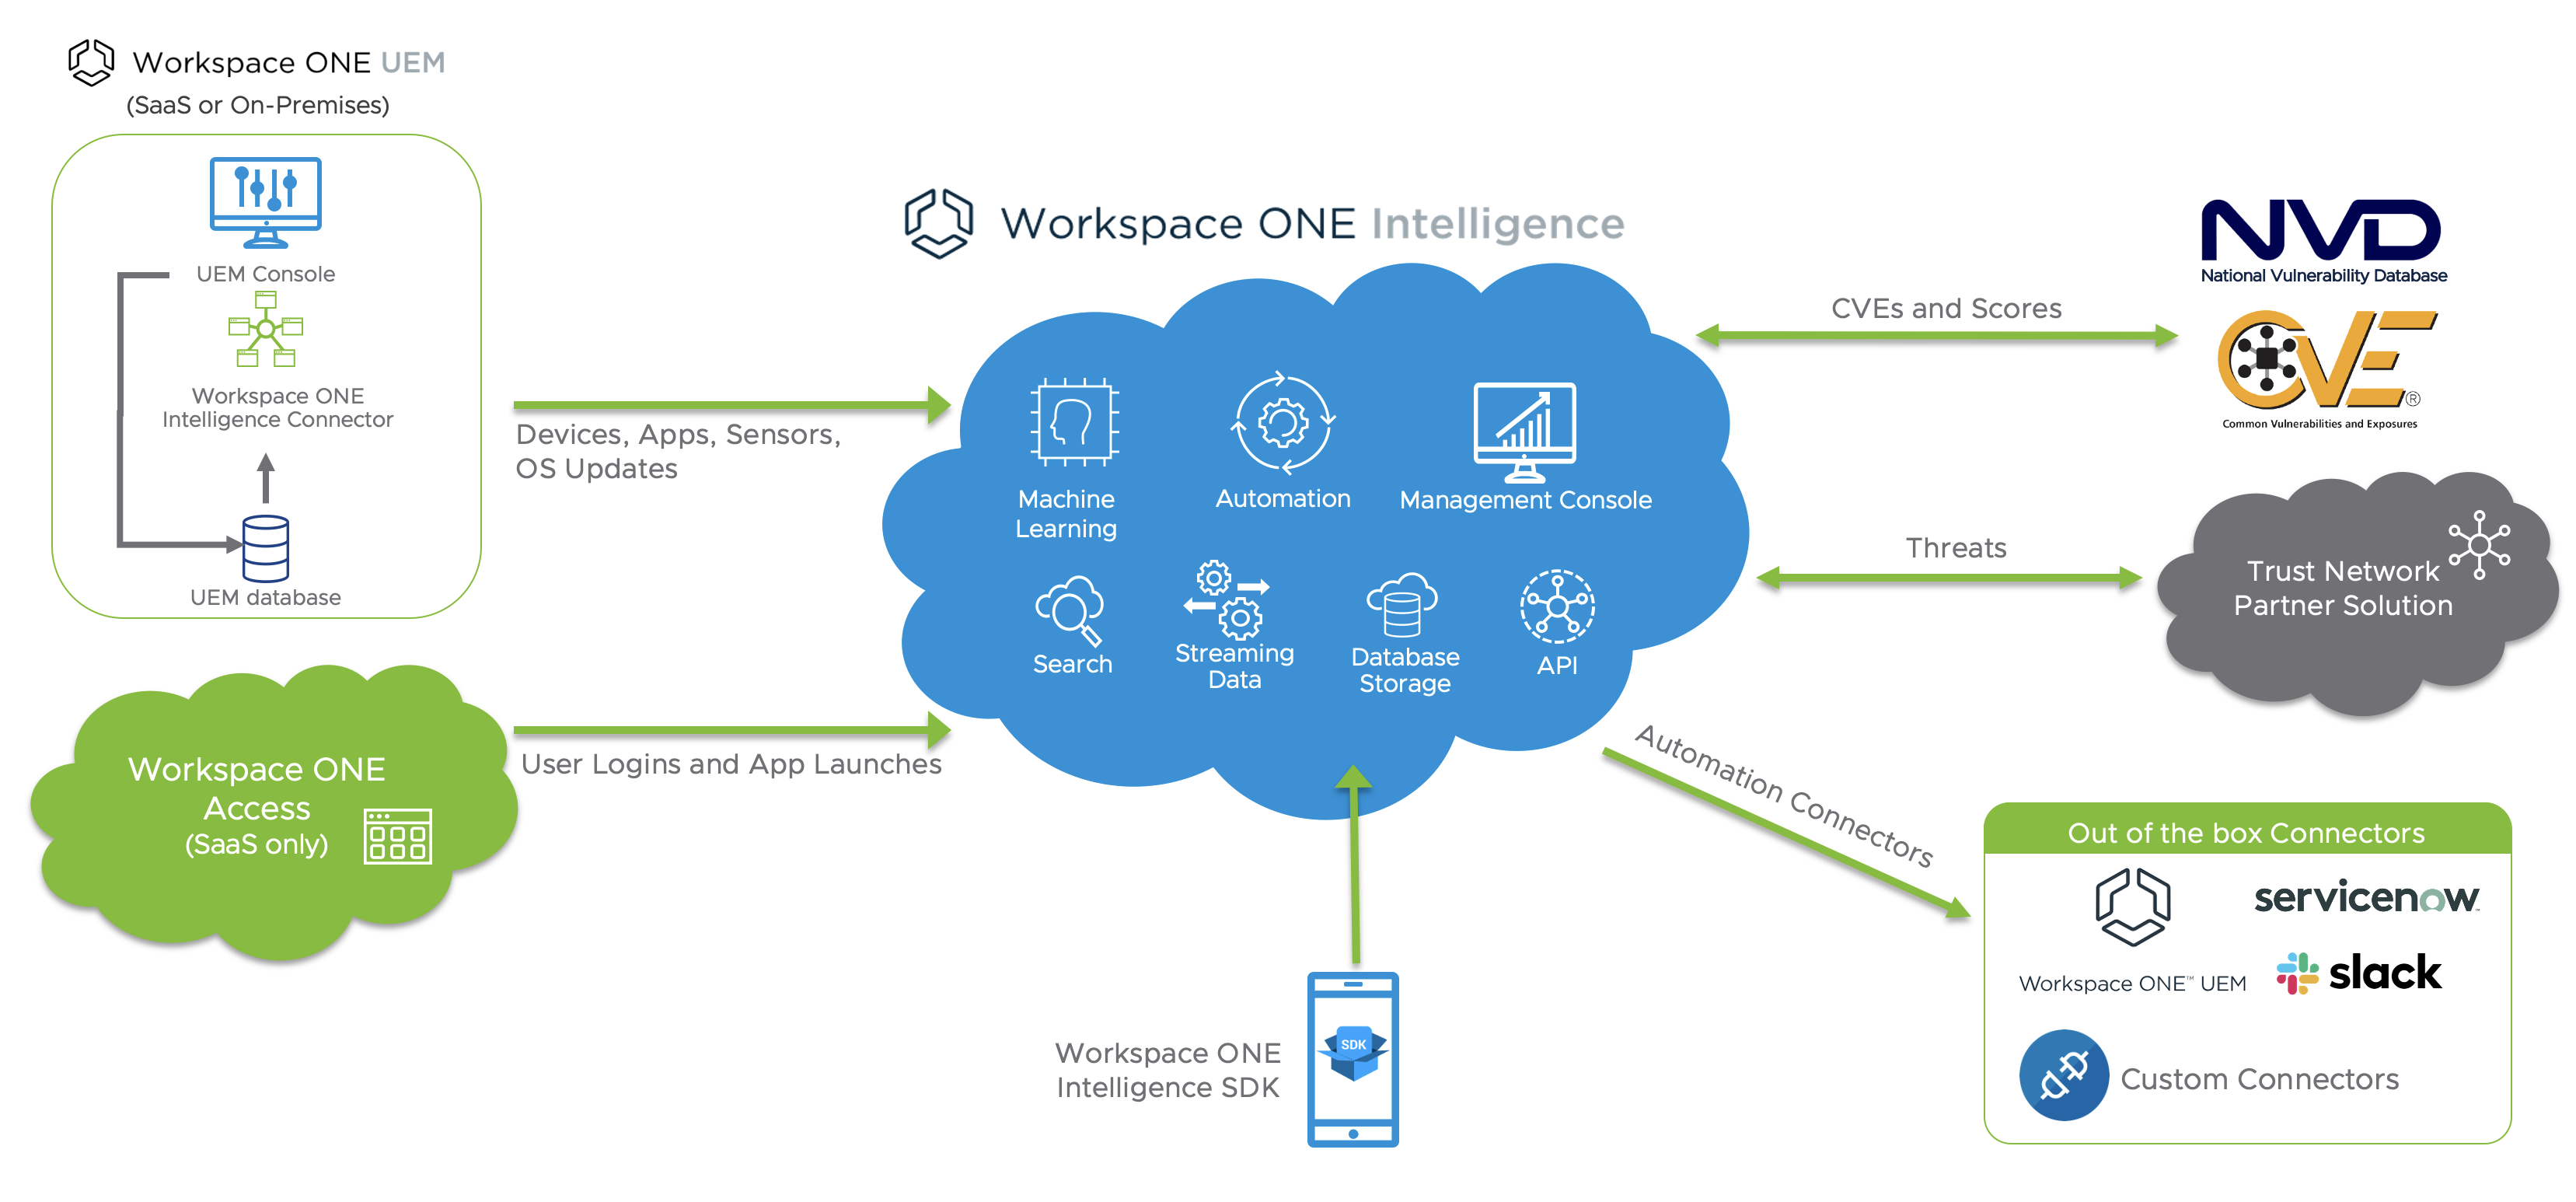
Figure 2: Data Sources for Workspace ONE Intelligence
Workspace ONE UEM
After a device is enrolled with Workspace ONE UEM, it starts reporting a variety of data points to the Workspace ONE UEM database, such as device attributes, security posture, and application installation status. Along with this, Workspace ONE UEM also gathers information about device users and user attributes from local databases and from Active Directory.
After the administrator opts in to Workspace ONE Intelligence, the Workspace ONE Intelligence Connector starts sending data. The data is aggregated and correlated by the platform for display purposes and to perform automated actions that enhance security and simplify user experience.
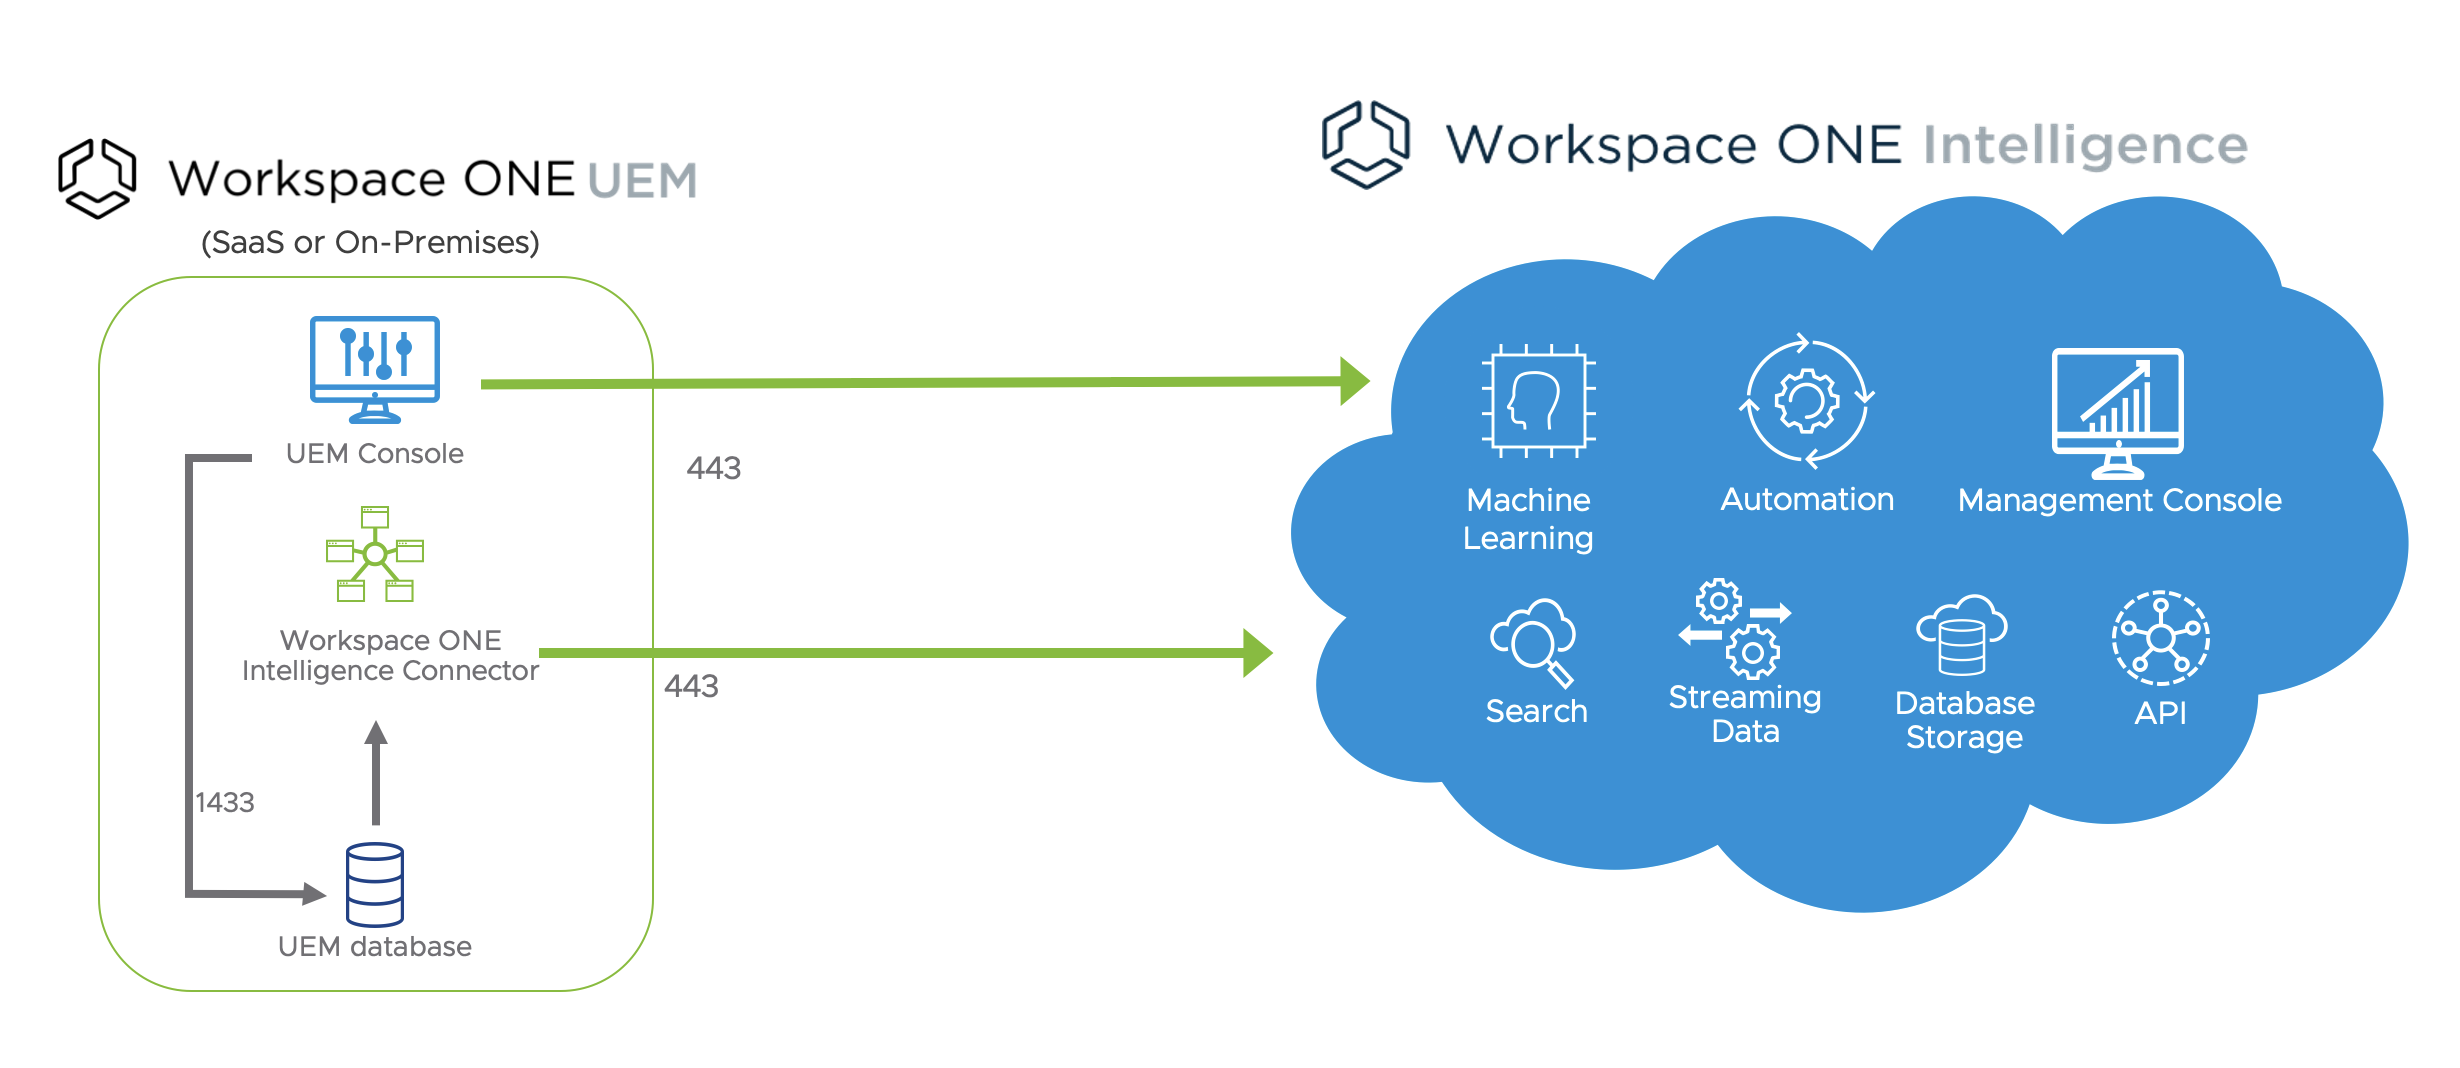
Figure 3: Workspace ONE Intelligence Components for UEM
The Workspace ONE Intelligence Connector service is responsible for aggregating the data from Workspace ONE UEM and feeding it to Workspace ONE Intelligence. After the data is extracted, the Workspace ONE Intelligence service processes it to populate dashboards and to generate reports based on the attributes selected by the intelligence administrator.
Your Workspace ONE Intelligence region is assigned based on your Workspace ONE UEM SaaS deployment location. No additional configuration is required to leverage Workspace ONE Intelligence. Find your shared and dedicated SaaS Workspace ONE UEM location and see its corresponding Workspace ONE Intelligence region at Workspace ONE UEM SaaS Environment Location Mapped to a Workspace ONE Intelligence Region.
Workspace ONE Intelligence Connector Design for On-Premises Deployment
When deploying Workspace ONE UEM on-premises, you will be asked to select a region to send data to during the installation of the Workspace ONE Intelligence Connector service. The service is available across multiple regions. To see a complete list of regions, see Trust Cloud Services Destinations for On-Premises.
The Workspace ONE Intelligence Connector service supports high availability and disaster recovery scenarios in either active/active or active/passive mode. VMware highly recommends deploying the Intelligence Connector service in a highly available configuration to ensure continued access to Workspace ONE UEM data through Workspace ONE Intelligence, and to ensure automations continue to run.
For high availability, deploy and enable at least two Intelligence Connectors. Both must be connected to the same SQL Server Always-On Listener. The synchronization of Workspace ONE UEM data with Workspace ONE Intelligence is performed by only one connector at a time—the active connector. If the active connector fails, one of the other connectors becomes the active connector and continues synchronization. This architecture is shown in the following figure.
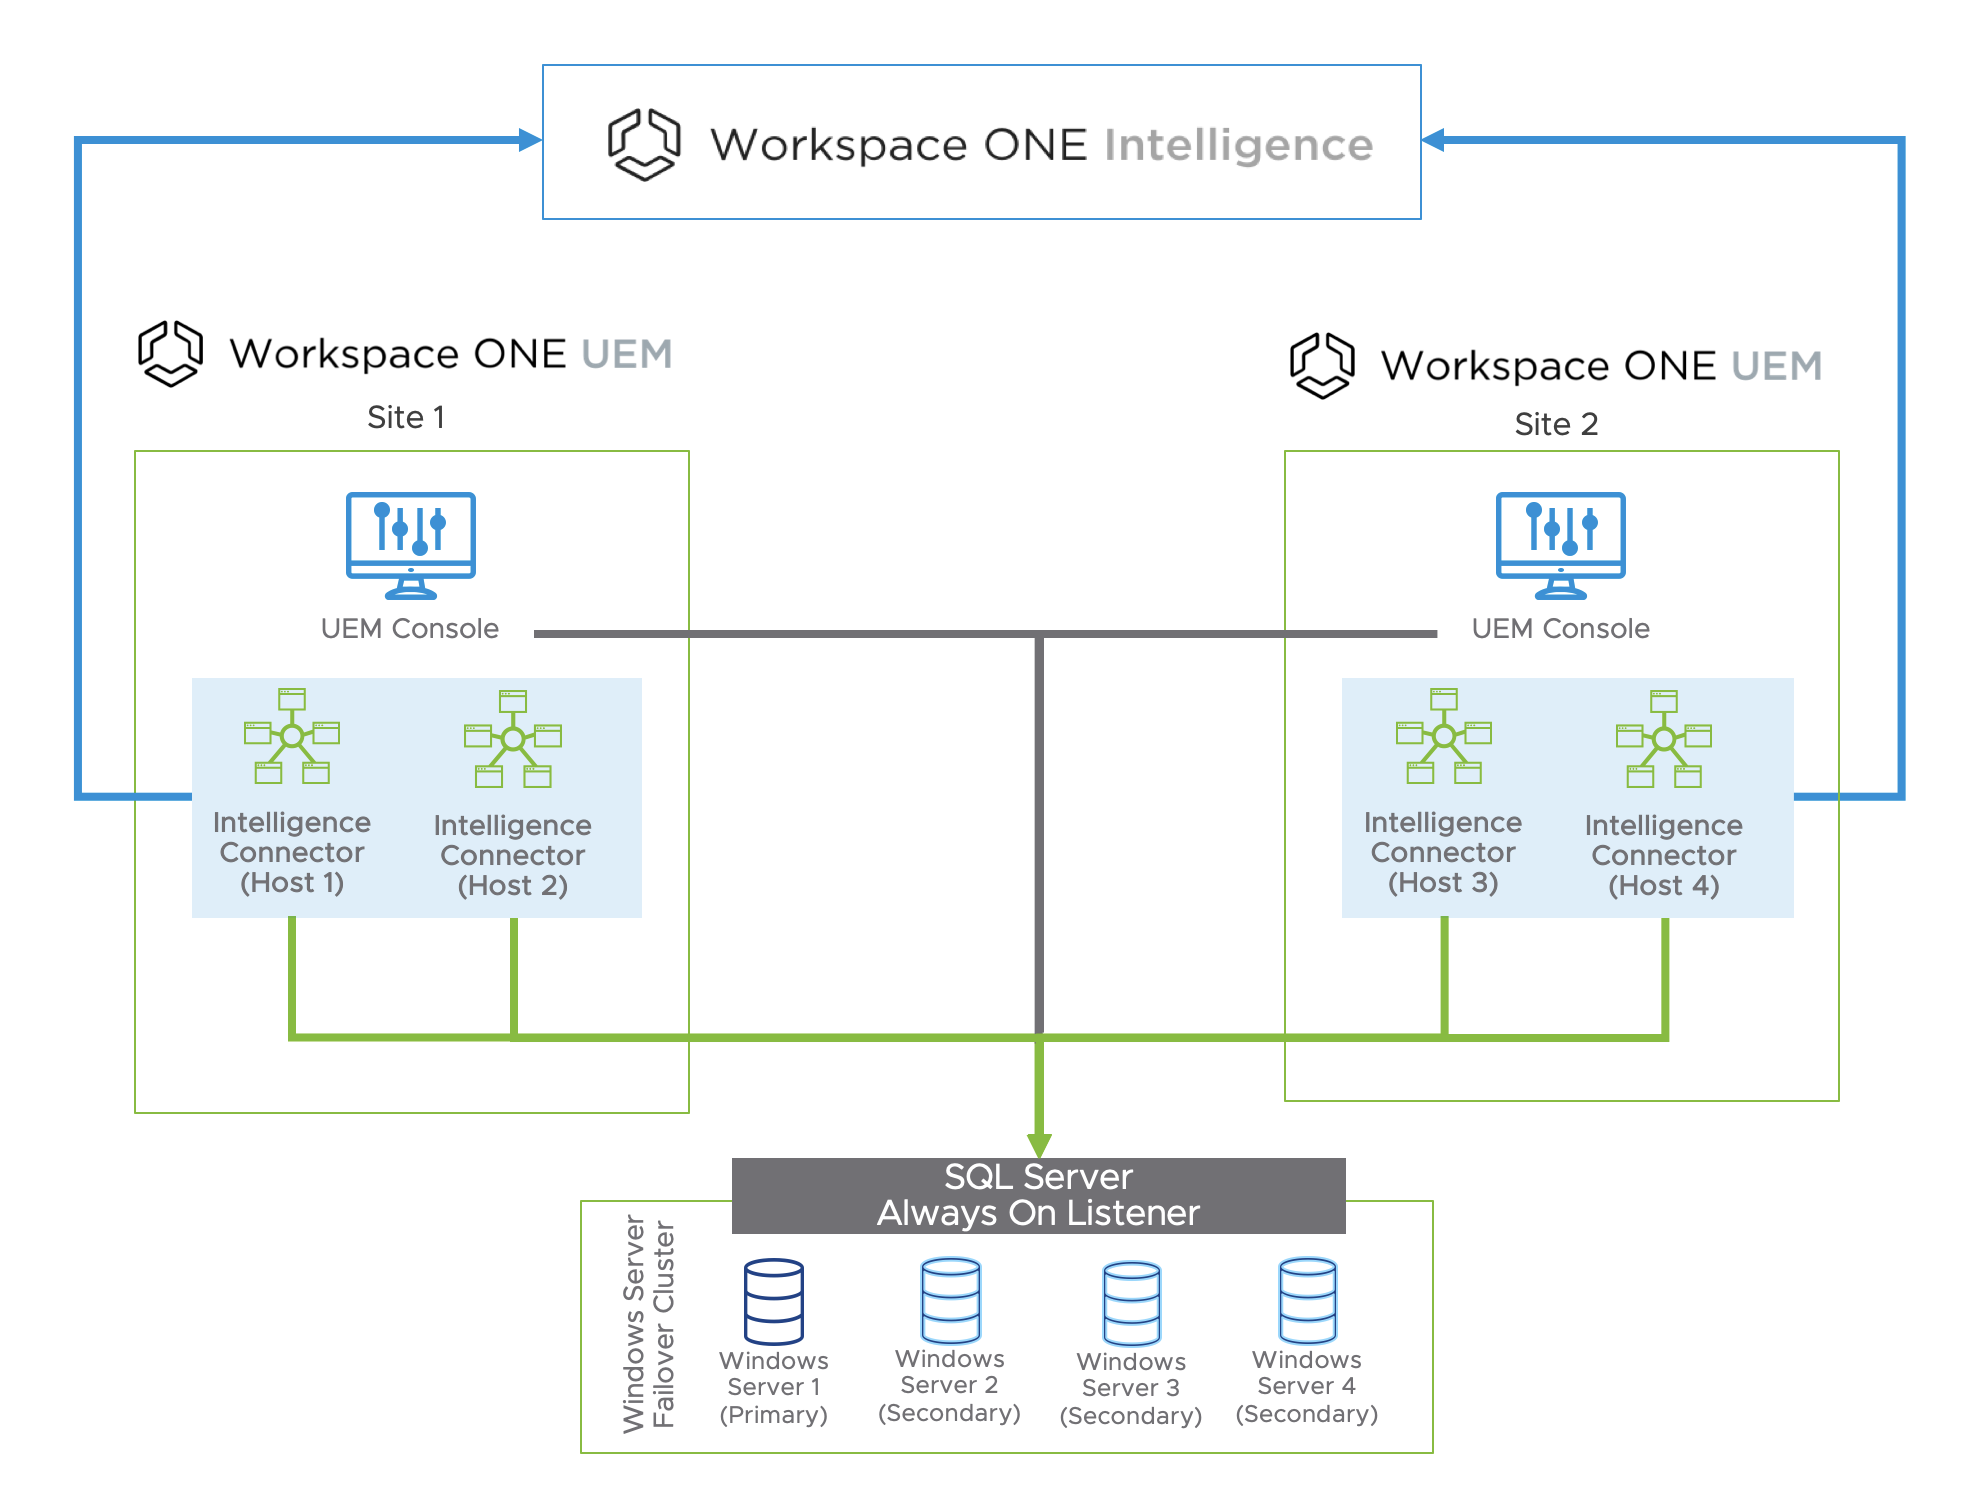
Figure 4: Multi-site Architecture for Workspace ONE Intelligence Connector
The Sync Status page in the Workspace ONE Intelligence Console reports the hostname of the Intelligence Connector that is actively synchronizing data.
For multi-site designs, the same HA principle applies. Deploy and enable the additional Workspace ONE Intelligence Connectors on the secondary site, and have them connect to the same SQL Server Always-On Listener. If your DR strategy for Workspace ONE UEM is based on active/passive mode, you can keep the Intelligence Connectors disabled or deactivated on the secondary site, and enable only when enacting the DR strategy.
For more information, see the Workspace ONE UEM and Workspace ONE Intelligence Integration section in Platform Integration.
Table 4: Implementation Strategy for On-Premises Workspace ONE UEM
| Decision | Two instances of Workspace ONE Intelligence Connector were deployed on each site and configured to aggregate data from the Workspace ONE UEM instance. |
| Justification | The Workspace ONE Intelligence Connector is required to send on-premises Workspace ONE UEM data to Workspace ONE Intelligence. |
Common Vulnerabilities and Exposures - CVE
CVE is a list of entries for publicly known cyber security vulnerabilities. With regards to Windows 10 managed devices, the CVE integration in Workspace ONE Intelligence performs a daily import of CVE details, as well as risk scores derived from the Common Vulnerability Scoring System (CVSS) defined by the National Vulnerability Database (NVD).
Because Workspace ONE UEM provides an update service for Windows 10 managed devices based on KBs released by Microsoft, Workspace ONE Intelligence is able to correlate its imported CVE details and risk scores with the Microsoft KBs.
The CVE information allows IT administrators and security teams to prioritize which vulnerabilities to fix first and helps them gauge the impact of vulnerabilities on their systems. This can be achieved through daily or even hourly reporting to security teams of all devices that are deemed vulnerable based on CVSS score.
Custom dashboards can then provide insights and real-time visibility into the security risks affecting all managed devices. The Workspace ONE Intelligence rules engine can take automated remediation actions, such as applying patches to the impacted devices.
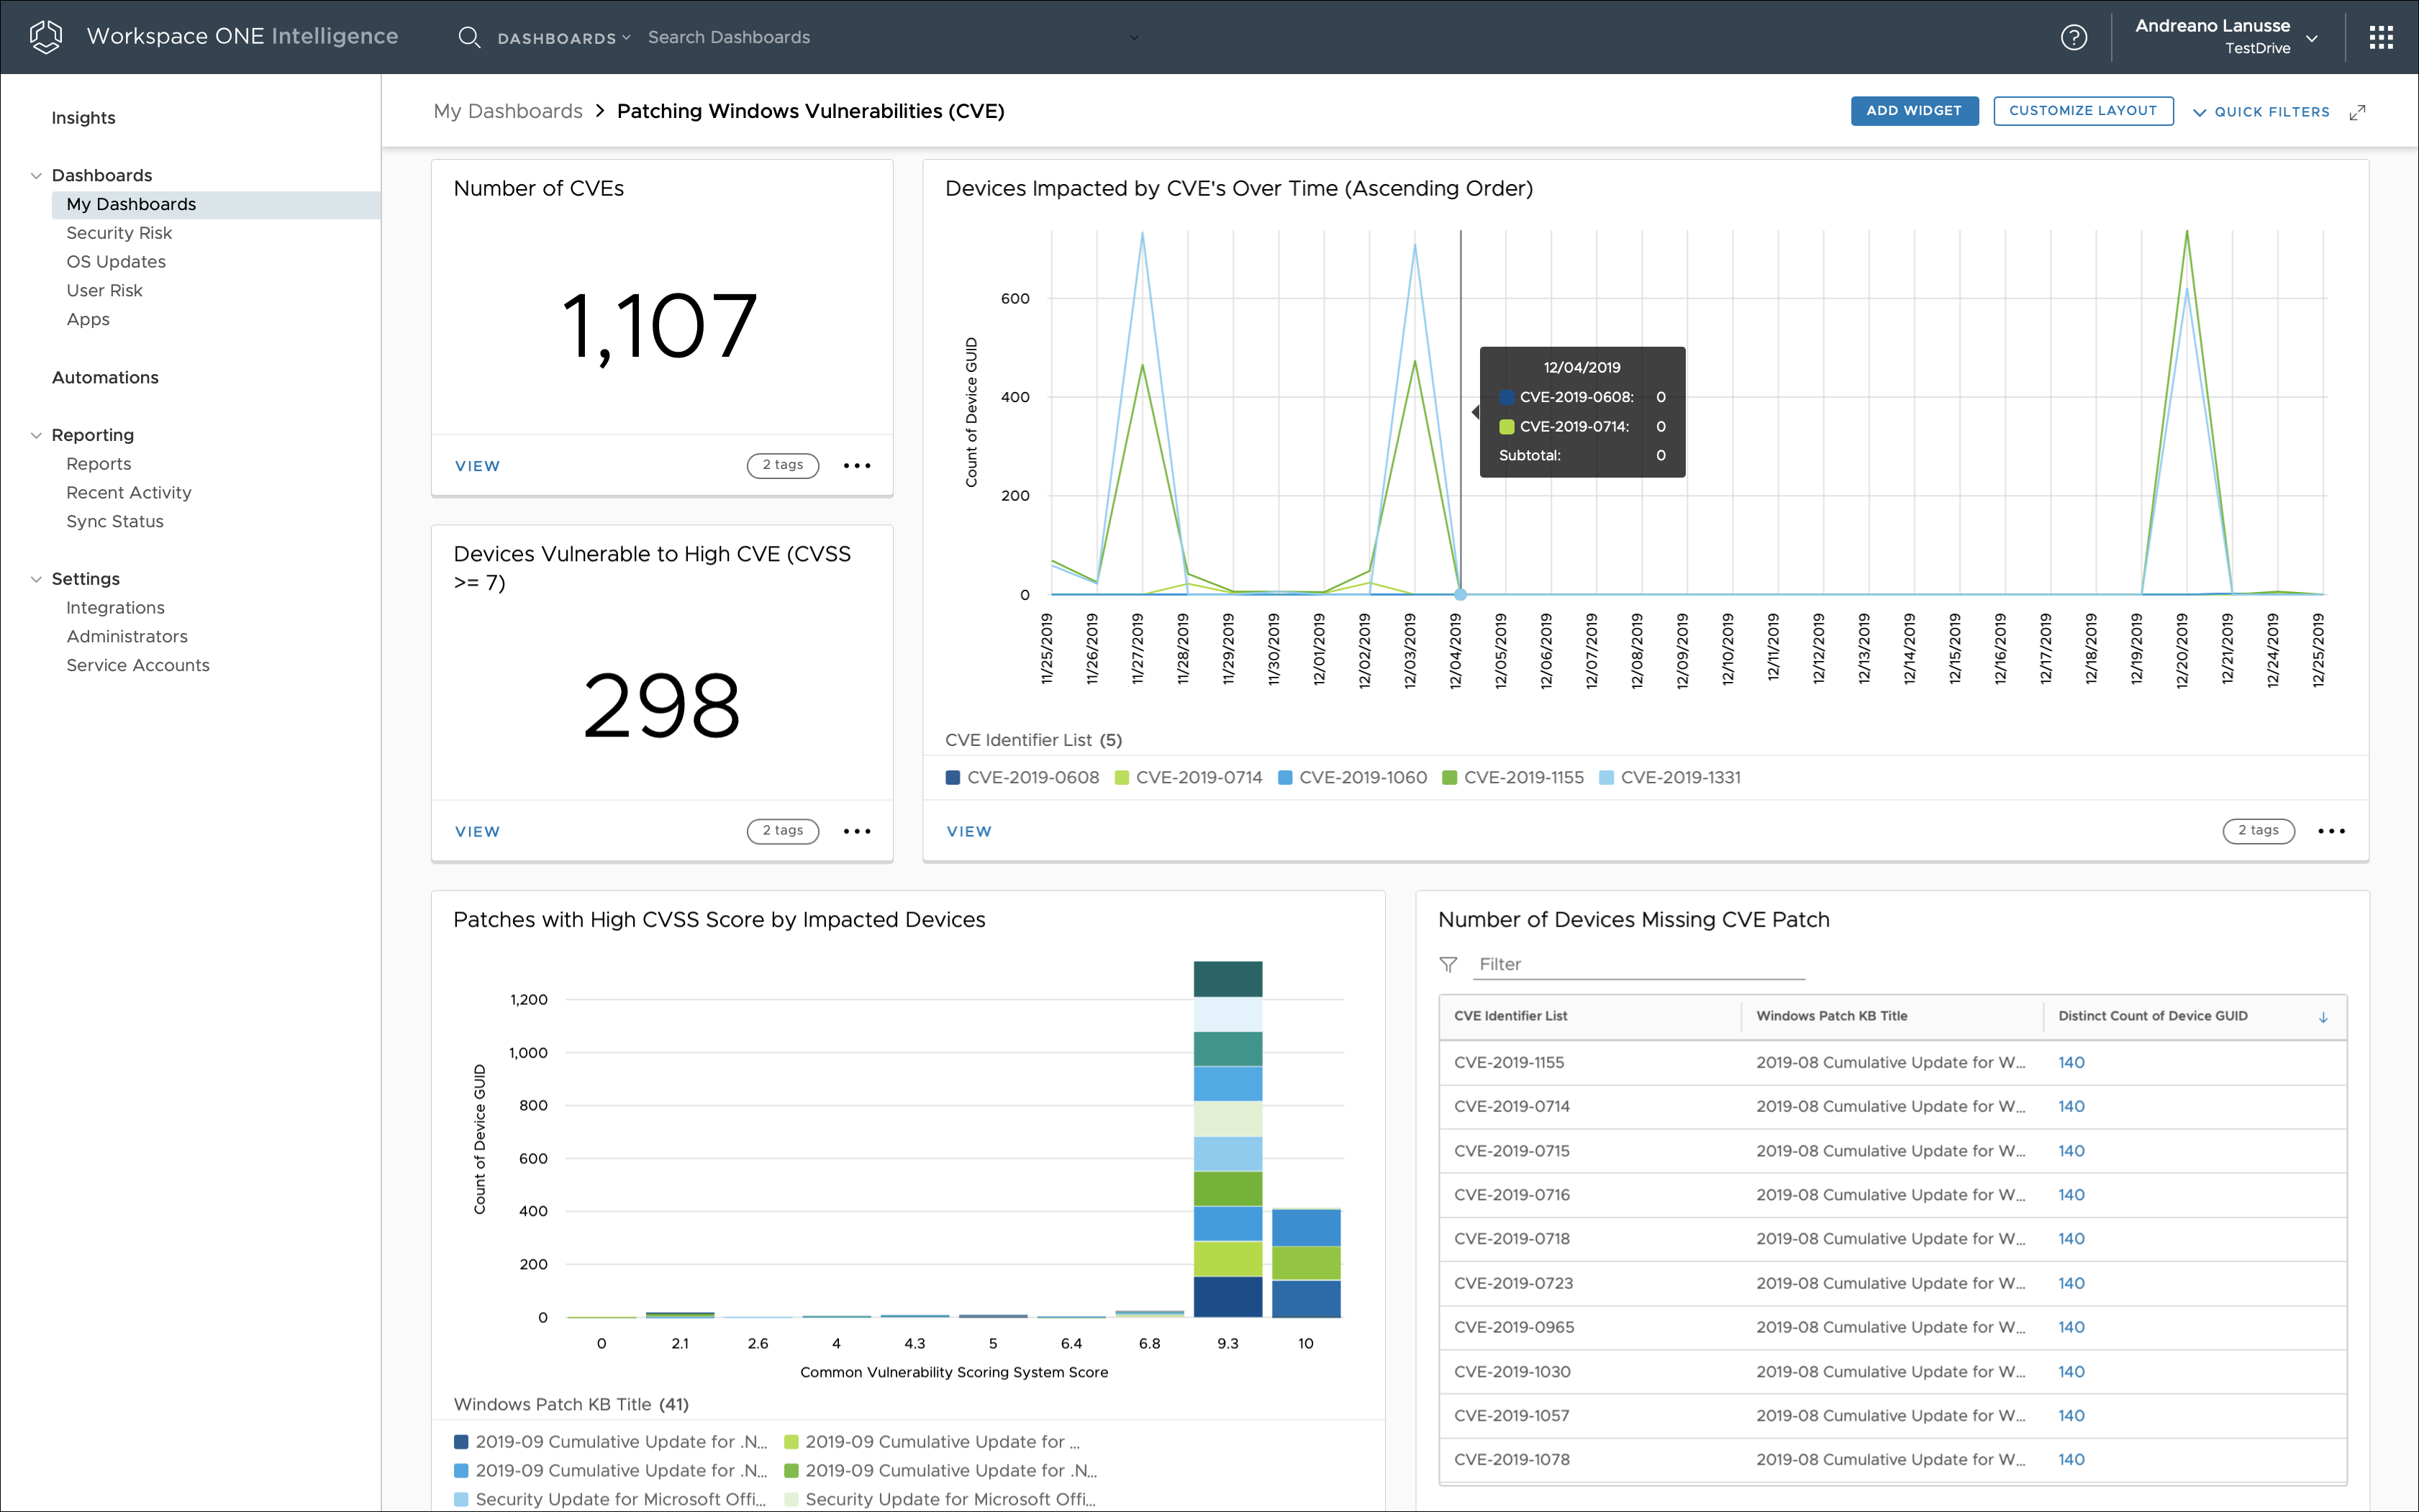
Figure 5: CVE Metrics Based on Workspace ONE Intelligence
So long as Workspace ONE UEM is integrated with Workspace ONE Intelligence through the Intelligence Connector service, no additional configuration is required to obtain and correlate CVE data.
Table 5: Strategy for Monitoring Security Risks to Windows 10 Devices
| Decision | The Workspace ONE Intelligence dashboard was configured to provide real-time visibility into the impact of CVE entries on Windows 10 managed devices. |
| Justification | Workspace ONE Intelligence increases security and compliance across the environment by providing integrated insights and automating remediation actions. |
Risk Analytics
Risk analytics is a feature of Workspace ONE Intelligence that assesses user risk by identifying practices that hinder security, such as employee negligence. Risk analytics provides a risk score for every device and user in an organization.
Each device gets a calculated risk score (low, medium, or high) on a daily basis, and for users with multiple devices, the user gets a risk score that is an aggregate of their scored devices. An organization needs to have at least 100 devices on the same platform for risk analytics to provide an accurate score. The risk analytics workflow consists of the following steps:
- Ingesting device data from Workspace ONE UEM
- Assessing risky user behaviors
- Computing a personalized risk score for every user and device, leveraging machine learning
- Conducting an automated response to mitigate the risks associated with the risky behaviors
The results are then available in the User Risk dashboard, as shown in the following figure.
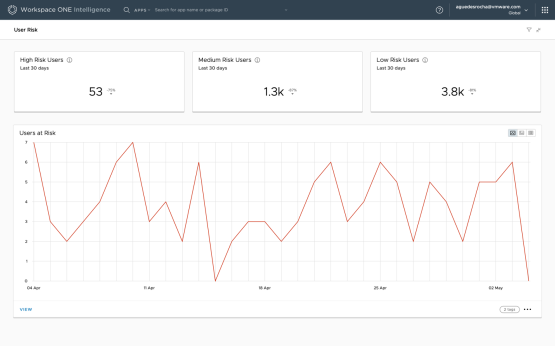
Figure 6: User Risk Dashboard Showing Risk Behavior Over Time in Workspace ONE Intelligence
A personalized risk score is calculated once a day for each device and user in an organization only when:
- Workspace ONE Intelligence is integrated with Workspace ONE UEM, as devices and applications are the main source of data for the machine learning models used by risk analytics.
- The environment contains at least 100 devices per platform that have been active in the past 14 days.
Note: Users with more than 6 devices are discarded because those devices are considered shared devices.
A user and device can get a score of low, medium, or high:
- Low – Indicates little potential to introduce threats and vulnerabilities to the network and internal resources.
- Medium – Indicates a moderate potential to introduce threats and vulnerabilities to the network and internal resources.
- High – Indicates a great potential to introduce threats and vulnerabilities to the network and internal resources.
A score is assigned to each device based on the risk indicators identified. The user score is the aggregation of device scores for all the devices owned by the user. The risk Indicators that contribute to risk scoring are organized into device and application categories.
The device risk Indicators are:
- Laggard Update – A person who lags behind others when it comes to updating software to the latest release.
- Risky Setting – A person who is reluctant to enable stricter security settings on a device.
Application risk indicators evaluate only mobile unmanaged apps when Workspace ONE UEM privacy settings allow access to the Personal Applications list. The application risk indicators are:
- Compulsive App Download – A person who downloads and installs an unusually large number of applications within a 14-day period and after 30 days of enrollment.
- Unusual App Download – A person who downloads and installs rare applications in a 14-day period and after 30 days of enrollment.
- App Collector – A person who has an unusually large number of applications on the device, no matter the timeframe.
- Rare App Collector – A person who has an unusually large number of rare applications on the device, no matter the timeframe.
Administrators can access the calculated score through out-of-the-box dashboards, custom dashboards, and reports. The User Risk and Device Risk dashboards allow IT administrators to identify risk trends at the organization level, showing the high-risk devices and users over time. With these dashboards, administrators can also access detailed information to identify why a user or device is getting flagged as high risk.
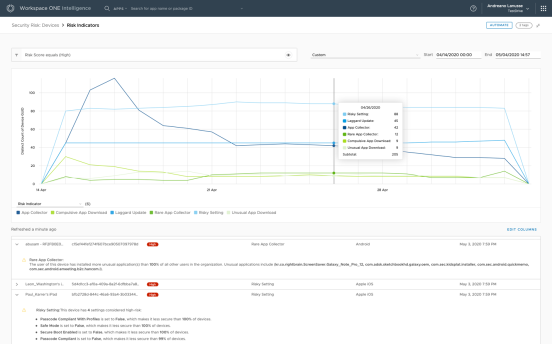
Figure 7: Device Risk Dashboard with Detailed View of Each Device
Support for automation is available based on device risk-score events. Automation allows administrators to mitigate risk based on device score and risk indicator changes, taking action against the device and third-party systems.
Risk analytics and automation can also be used to nudge (influence) users’ behaviors and lead to greater compliance across an organization. For instance, social proof feedback could be implemented to help users identify desirable behaviors and motivate them to take action. For example, a user who receives a Laggard Update risk indicator can be nudged with a simple social proof intervention, such as the following message: “Dear user, your device is running an old operating system; 99% of the devices in your organization are running a newer version. Here are the instructions to update your device...”
The following screenshot shows an example of how an administrator might configure a Slack message to be sent when the system finds a certain risk score in combination with a certain number of risk indicators.
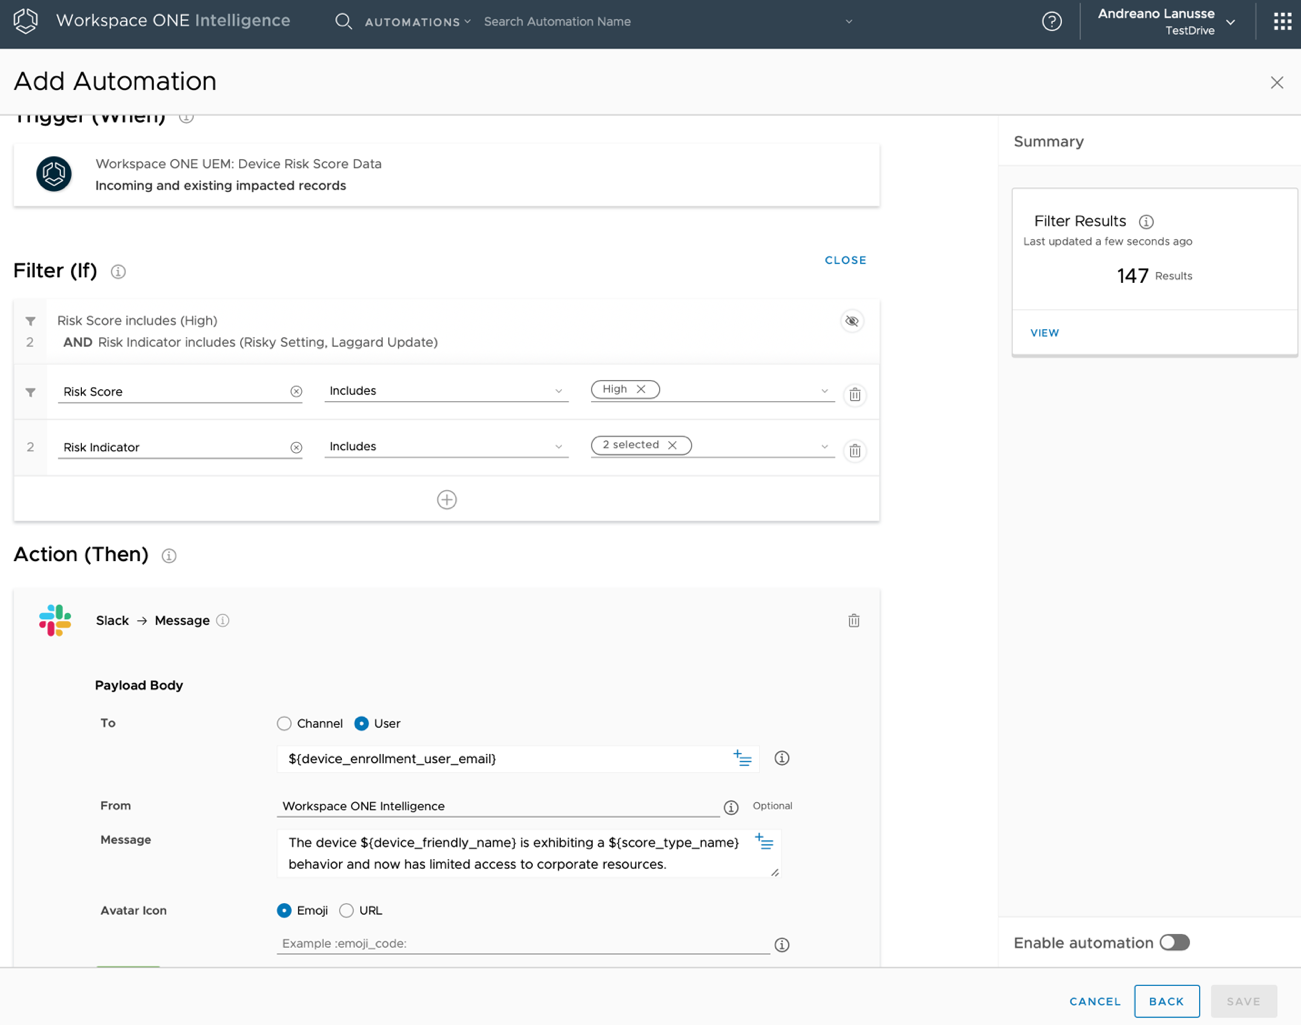
Figure 8: Automation Based on Device Risk Events
Risk analytics integrates with Workspace ONE Access (cloud only), enhancing conditional access beyond mere device compliance. Risk analytics adds risk-based conditional access, allowing Workspace ONE Access to assess risk in real time before allowing users to access their business applications.
Integration between Workspace ONE Intelligence and Workspace ONE Access is required to allow the administrator to enable the Risk Score Adapter in Workspace ONE Access. The administrator can then select the type of actions that identify low-, medium-, and high-risk users when those users attempt to access their business applications through Workspace ONE.
When enabling the Risk Score Adapter, administrators must configure the type of action to apply to the score. The action associated with the risk score determines the user experience:
- Allow Access – The user can log in, and access policy rules are followed.
- Step-Up Authentication – The user cannot log in with only the credentials that were entered. The next authentication method configured in the access policy is presented to the user.
- Deny Access – The user cannot log in and no other login option is presented to the user.
This configuration will enable the risk-score authentication method on the access policy, allowing the use of risk-based conditional access.
Important: The risk score can be used only after the first authentication method is applied because the user must be identified before the risk score can be looked up.
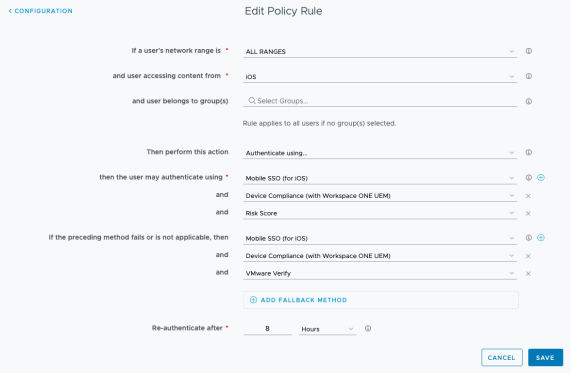
Figure 9: Workspace ONE Access Policy Configuration That Uses a Risk-Score Authentication Method
For an in-depth understanding of risk analytics, instructions for integration with Workspace ONE Access, and a demonstration of integration in action, watch the video Workspace ONE Intelligence: Understanding Risk Analytics - Deep Dive.
Workspace ONE Access
Integrating Workspace ONE Access with Workspace ONE Intelligence allows administrators to track login and logout events for applications in the Workspace ONE catalog. This integration also captures application launches in the Workspace ONE catalog for both Service Provider (SP)–initiated and Identity Provider (IdP)–initiated workflows. This information is available for web, native, and virtual applications and is presented in preconfigured and as well as custom dashboards.
IT administrators can gather insight into:
- Application adoption – By determining how many unique users have launched a particular application
- Application engagement – By collecting user-experience statistics about the most-used applications
- Security issues – By examining data about failed login attempts
User login events are represented by the following types:
- Login – A user attempts to access an app listed in the Workspace ONE catalog.
- Note: Just logging in to the Workspace ONE catalog alone does not count as a user login.
- Logout – A user manually logs out of the Workspace ONE catalog. A logout event is not generated when:
- A user logs out of a particular app, because the user is still authenticated to the catalog.
- The session times out or the user closes the browser.
- Login failures – A user enters an incorrect password, the second factor of two-factor authentication is incorrect, the certificate is missing, and so on.
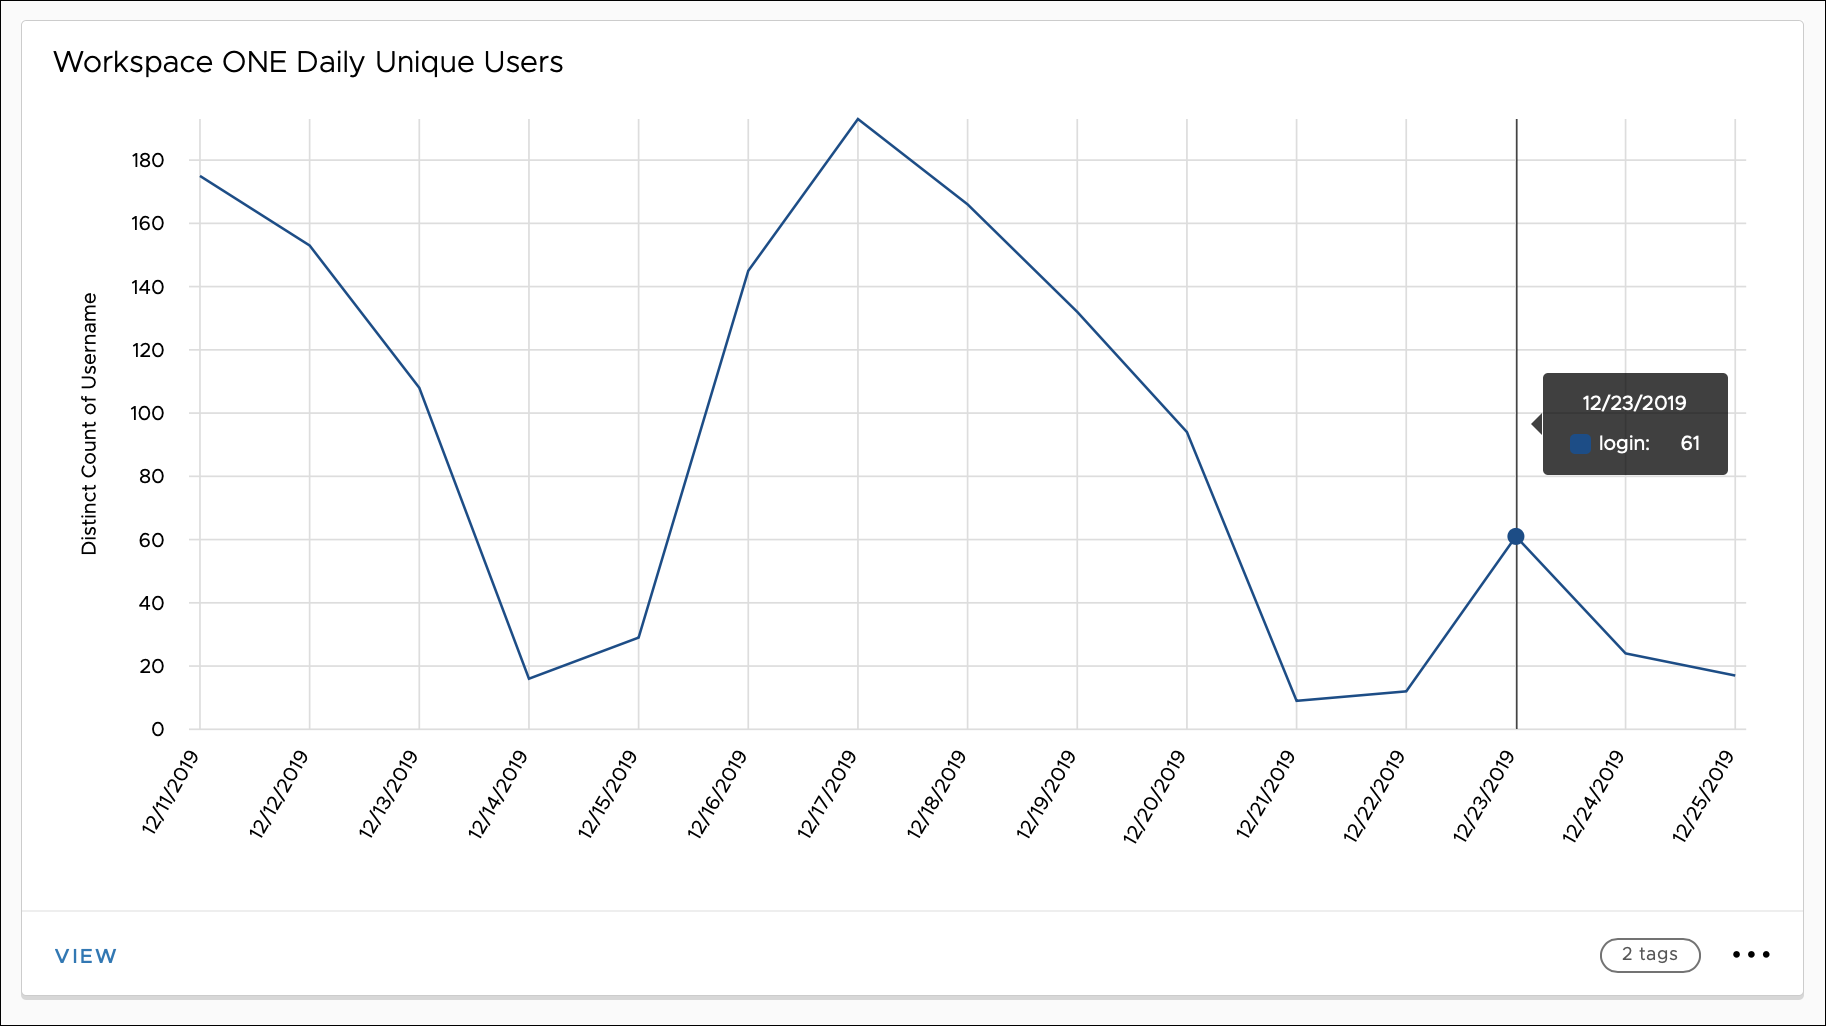
Figure 10: Daily Unique Users of Workspace ONE represented by Widgets in Workspace ONE Intelligence
App launch events are captured under two scenarios:
- A user launches an app from the Workspace ONE catalog (IdP-initiated).
- A user navigates directly to a web app, so that SSO occurs through Workspace ONE (SP-initiated).
App launch events are captured for web, SaaS, and virtual apps, and for any other type of app configured as part of the Workspace ONE catalog. To provide insights about these apps, Workspace ONE Intelligence displays information about app events through widgets in the Apps dashboard.
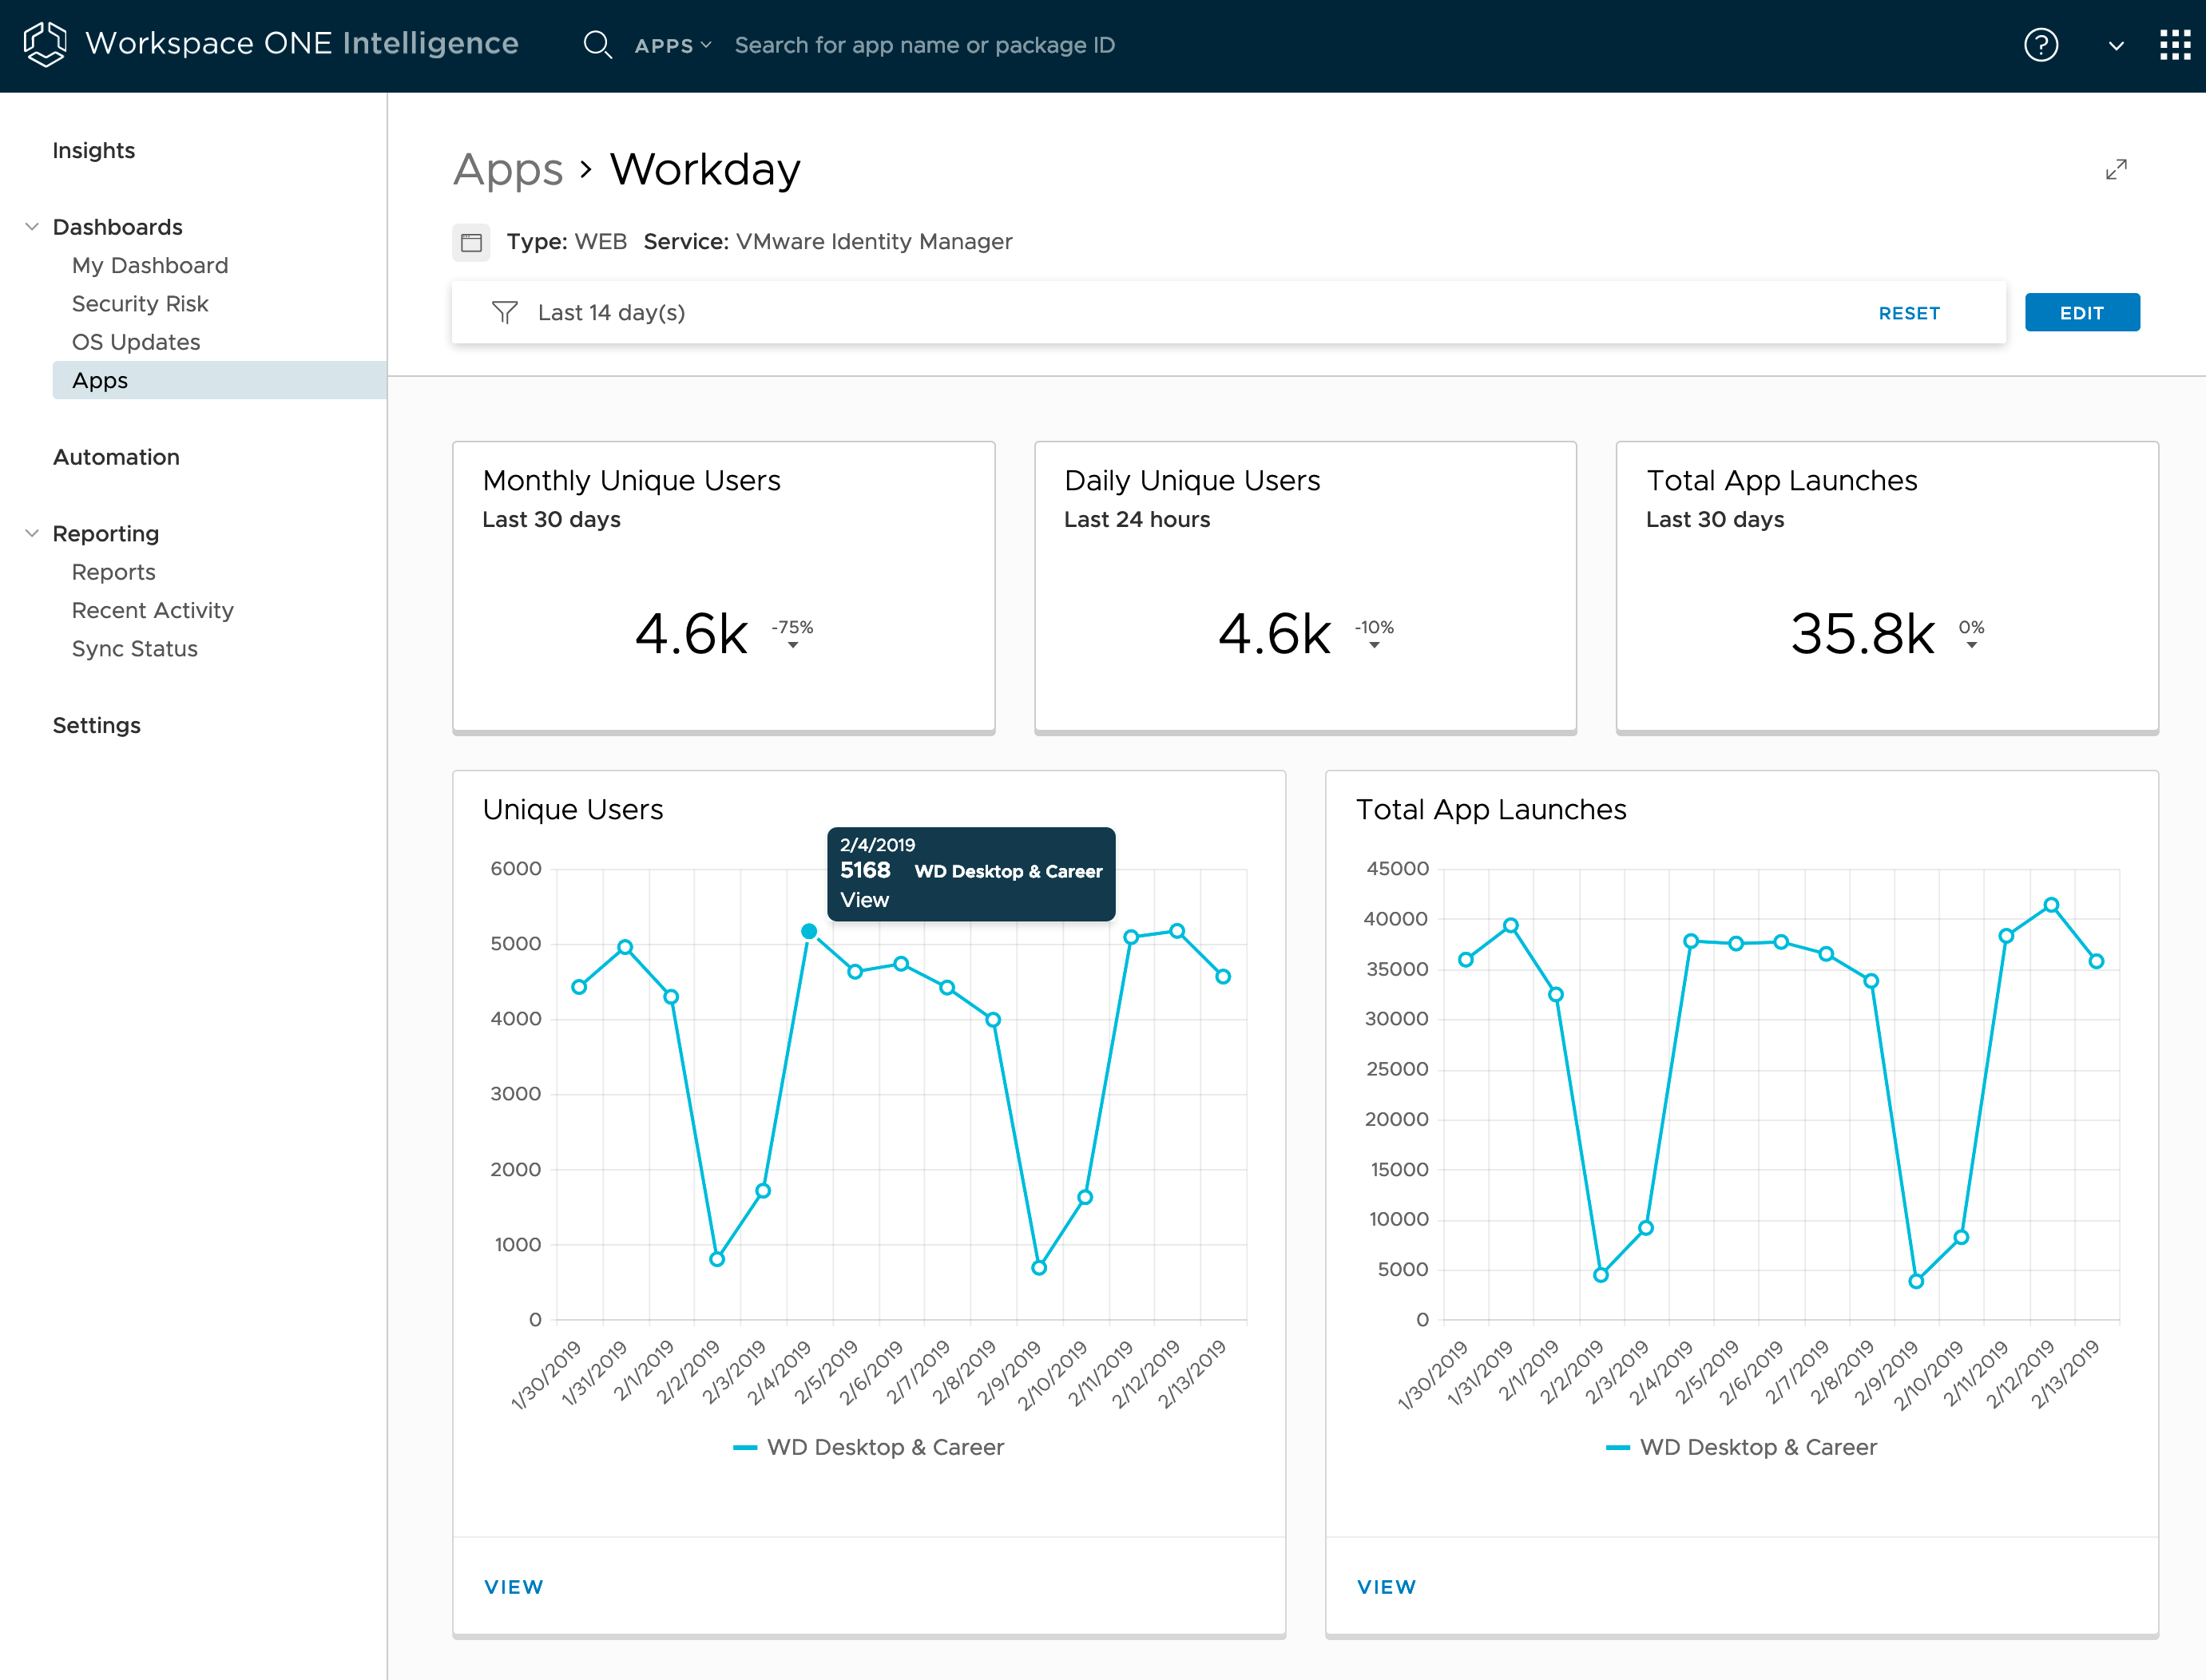
Figure 11: Apps Dashboard for the Workday Web App Launched from Workspace ONE Access
To add Workspace ONE Access as a data source to Workspace ONE Intelligence, navigate to Intelligence Settings in the Intelligence dashboard and select Workspace ONE Access. Enter the tenant URL for the Workspace ONE Access cloud-based tenant and select Authorize. For more information, see the Workspace ONE Access and Workspace ONE Intelligence Integration section in Platform Integration.
Only cloud-based instances of Workspace ONE Access can be integrated with Workspace ONE Intelligence. On-premises deployments of Workspace ONE Access cannot be integrated into Workspace ONE Intelligence.
Table 6: Implementation Strategy for Integrating Workspace ONE Access
| Decision | Workspace ONE Intelligence was configured to collect data from Workspace ONE Access. |
| Justification | This strategy collects user data around events and users from Workspace ONE Access and integrates this data with Workspace ONE Intelligence. Web application data displays on the Apps dashboard, allowing the visualization of both Workspace ONE logins and application load events. |
Workspace ONE Trust Network
Integrating VMware Workspace ONE® Trust Network with Workspace ONE Intelligence provides insight into threats detected by each of the Trust Network components configured in the environment. With this information, administrators can get insights through predefined dashboards and custom widgets, and administrators can create automations based on threat events.
Workspace ONE Intelligence integrates with VMware Carbon Black Cloud™ (formerly CB Defense) to determine threat activities in real time from Windows and macOS endpoints, allowing IT administrators to define automated actions against managed devices when a threat is identified.
Additional security solutions such Lookout on Mobile Threat Defense (MTD) and Netskope on Cloud Security Broker (CSB) can be leveraged to enhance endpoint and data protection. Both products are also part of the Workspace ONE Trust Network and integrate with Workspace ONE Intelligence.
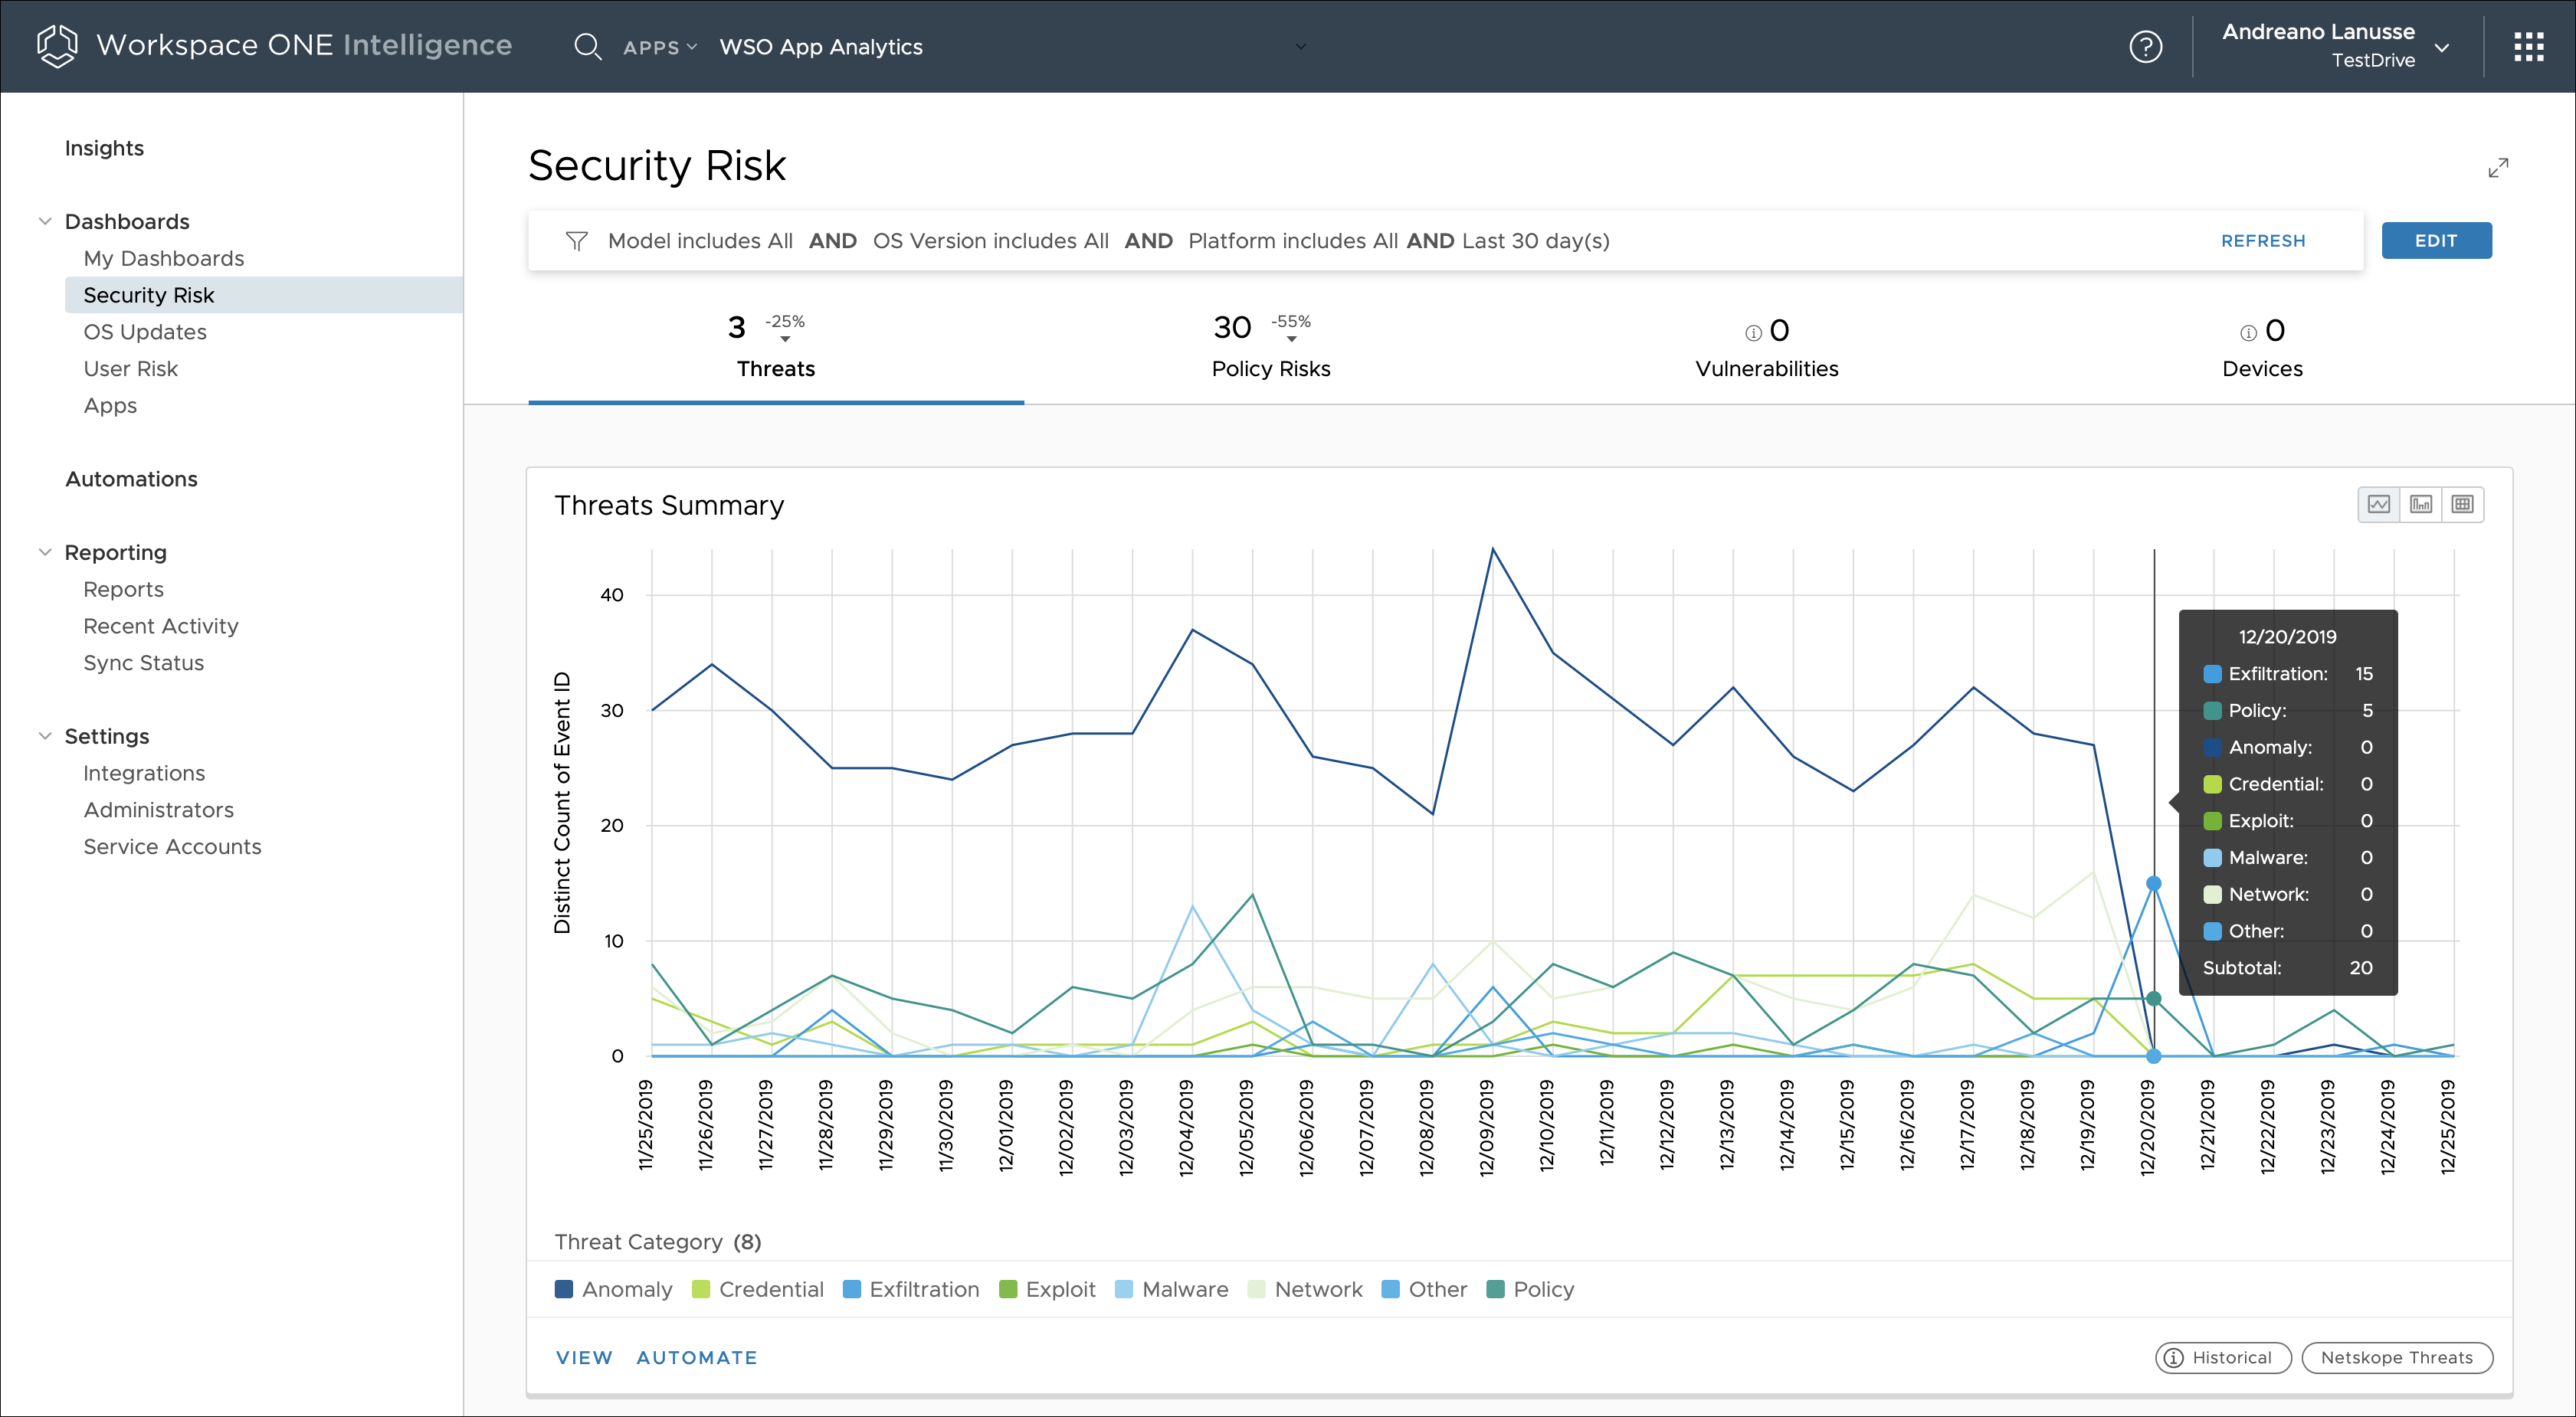
Figure 12: Consolidated Threat View Reported by Trust Network Solutions Over Time in Workspace ONE Intelligence
For more information, see the Workspace ONE Intelligence and Trust Network Integration section in Platform Integration.
Table 7: Implementation Strategy for Integrating Trust Network
| Decision | Workspace ONE Intelligence was configured to collect data by using both Carbon Black Cloud (formerly CB Defense) and Lookout for Work. |
| Justification | This strategy collects threats from Windows and macOS devices using CB Defense agent. It collects threats from iOS and Android using Lookout for Work. This strategy gives the Workspace ONE Intelligence administrator a consolidated view across the four major device platforms. The administrator can also create automated actions to address threats against managed devices. |
App Analytics with Workspace ONE Intelligence SDK
Workspace ONE Intelligence SDK (formerly known as the Apteligent SDK) monitors, prioritizes, helps troubleshoot, and reveals trends of your native mobile app performance issues in real time.
Integrating the Workspace ONE Intelligence SDK with Workspace ONE Intelligence provides insight into app and user behavior analytics. App analytics is available as part of Workspace ONE Intelligence Enterprise apps and Consumer Apps. Both use the Intelligence SDK, and the integration process is the same for both.
Workspace ONE Intelligence SDK is available for iOS and Android platforms, and can be downloaded from the VMware Code downloads page for Workspace ONE Intelligence.
After the Workspace ONE Intelligence SDK is embedded in an app and that app is registered with Workspace ONE Intelligence, a unique app ID is generated, which is required to be added to the application. The app ID can be hard coded, but for managed apps, VMware recommends using App Config, which allows the application to receive the app ID from Workspace ONE UEM. This process simplifies the redeployment of applications without requiring an additional configuration update.
The SDK initialization process requires a minimal addition of code. Basically, you add a method that is called to pass the app ID generated in Workspace ONE Intelligence and start report the App Load events. To learn more about how to initialize the SDK, see:
- iOS Guide / Installation and Setup / Setting Up Workspace ONE Intelligence SDK (iOS)
- Android Guide / Installing the Android SDK / Initializing Workspace ONE Intelligence SDK (Android)
As the applications get deployed and are launched by end users on their devices, the SDK sends the data to Workspace ONE Intelligence Cloud Service. The Apps dashboard starts populating the relevant data and correlates data from the Workspace ONE Intelligence SDK and Workspace ONE UEM.
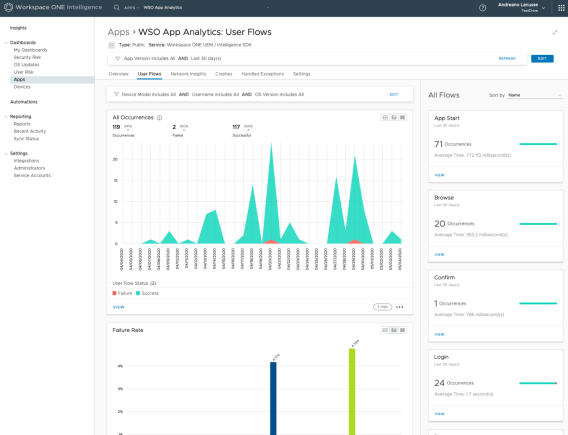
Figure 13: User Flow Metrics on the Apps Dashboard
The Apps dashboard displays app data fed from the Workspace ONE Intelligence SDK. The data is organized as shown in the following table.
Table 8: App Dashboard Summary
| Widget | Description |
| Overview | Includes metrics for daily active users (DAU), monthly active users (MAU), app loads, and deployment status based on correlated data from the Workspace ONE Intelligence SDK and Workspace ONE UEM. For the UEM correlated data, administrators can identity:
|
| User Flows | Includes metrics for key interactions in the app such as login, account registration, in-app purchases, and more. The App Load user flow is available out of the box. Other key user flows that are specific to the apps give detailed visibility into the user flows that succeeded or failed (that is, that crashed or had user-defined failures). These user flows are easy to implement. |
| Network Insights | Includes metrics to monitor service and API metrics for apps on endpoints. See data concerning error rates, status and error codes, response times, number of calls, and data bandwidth for network calls. |
| Crashes and Handled Exceptions | Monitors crashes and handled exceptions, giving visibility into error rate, stack trace, diagnostic details, users affected to prioritize fixes, troubleshooting help, and finding the root cause to resolve issues. |
| Breadcrumbs | Includes automatic network events, handled exception events, crash events, and system events such as session start or app foregrounded/backgrounded. These events are stitched together to form a breadcrumb trail before the crash or handled exception occurs. Breadcrumbs are also available for successful and failed user flows. |
| Settings | Provides the ability to upload symbol (.dSYM) files for iOS and mapping.txt files for Android. Download the Workspace ONE Intelligence SDK for iOS and Android platforms. |
Use a custom dashboard to create your own visualization tool and to manipulate data about user behaviors, app loads, crashes, handled exceptions, user flows, network insights, and so on. Use the Workspace ONE Intelligence SDK category to select metrics concerning your SDK-integrated apps.
- App Loads
- Custom Events
- Network Errors
- Application Events
- User Flows
- iOS Crashes
- Android Crashes
- Processed iOS Crashes
- Processed Android Crashes
Processed iOS Crashes and Processed Android Crashes include only symbolicated crash reports. To process crashes successfully, you must upload symbol (.dSYM) files for iOS apps and ProGuard mapping.txt files for Android apps. Workspace ONE Intelligence App analytics requires these files to process crashes successfully, to symbolicate them, and to group them.
The prerequisites for app analytics are that enterprise applications have the Workspace ONE Intelligence SDK embedded in them and that applications are managed by Workspace ONE UEM. For business-to-consumer apps, there is no need for managed devices. However, those types of apps must be registered with Workspace ONE Intelligence for Consumer Apps, which is a separate intelligence tenant that contains only the app analytics features.
The platforms supported with the Workspace ONE Intelligence SDK are Apple (iOS, tvOS) and Android. For more information refer to the Workspace ONE Intelligence SDK Guide.
Mobile apps that integrate with the Workspace ONE Intelligence SDK must be registered in Workspace ONE Intelligence by following the instructions in Register Consumer Apps, or through the step-by-step video VMware Workspace ONE Intelligence: Integration with Apteligent - Feature Walk-through. The registration process enables the visualization of app analytics through the Apps dashboard and available widgets.
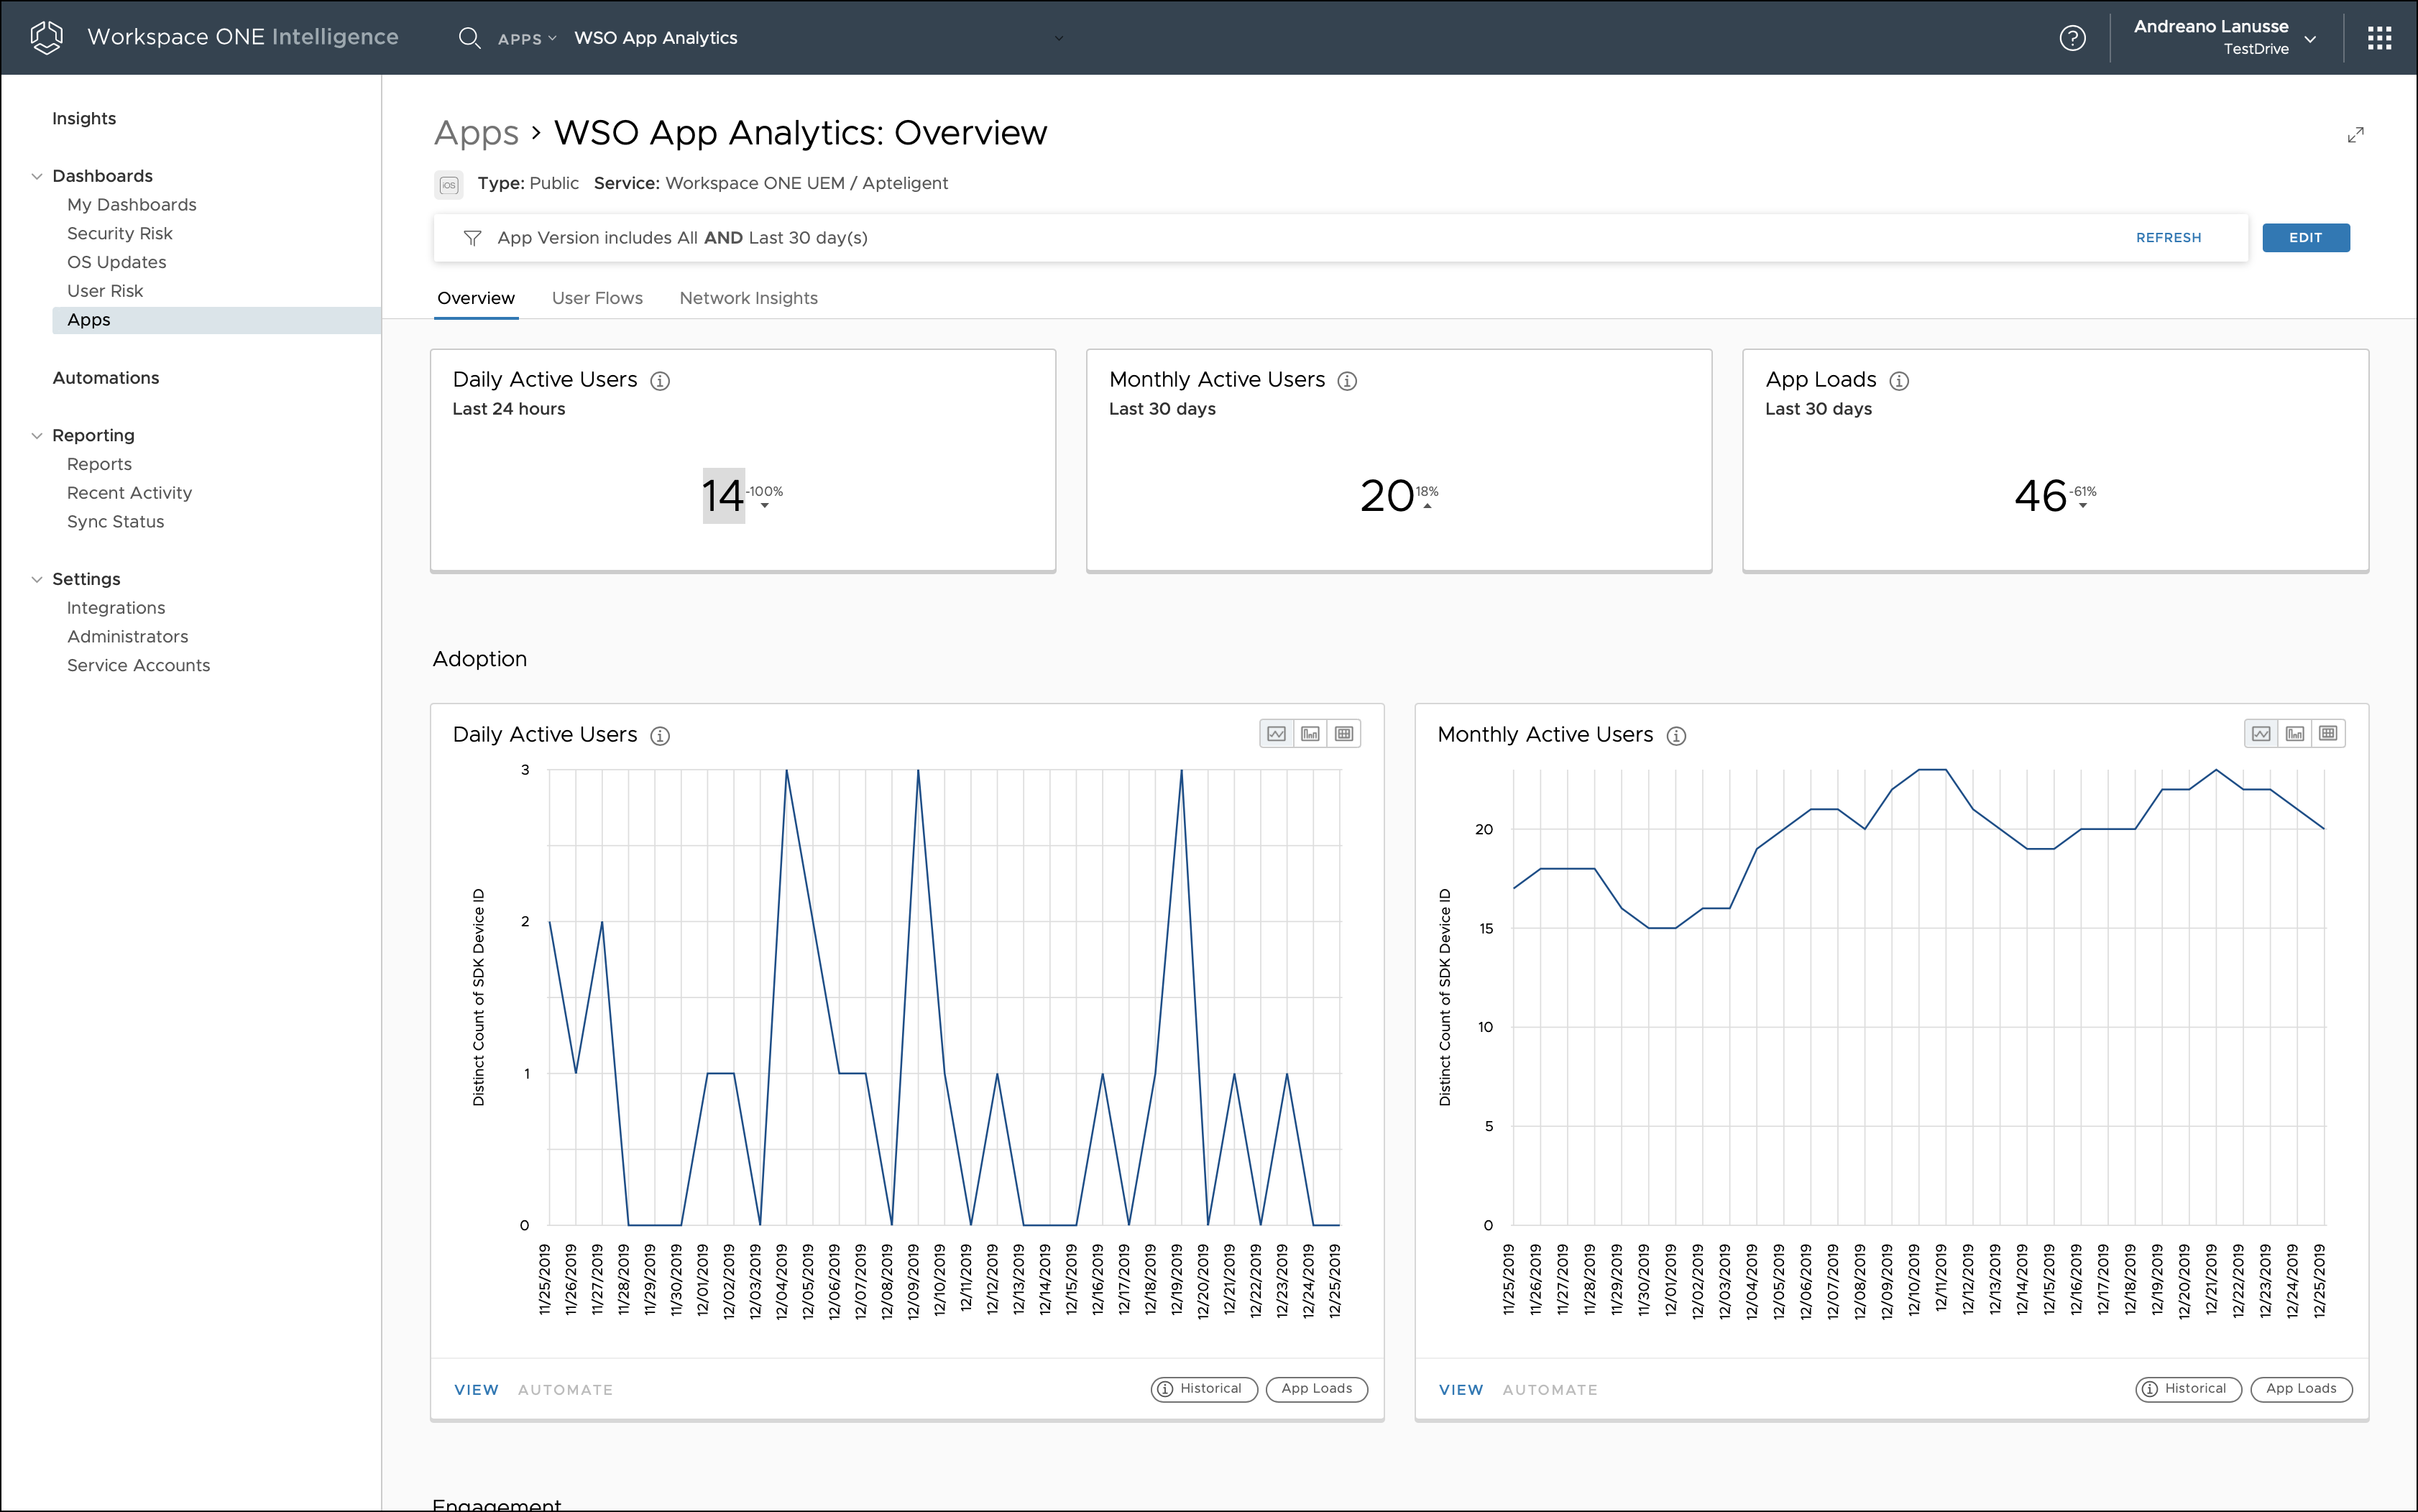
Figure 14: App Analytics for a Native Mobile App Integrated with the Workspace ONE Intelligence SDK
To leverage the full capabilities of app analytics, you can leverage the Workspace ONE Intelligence SDK. For more information, see the Workspace ONE Intelligence Dev Center.
Insights and Automation
All data collected from the data sources is aggregated and correlated by the Workspace ONE Intelligence service. The data is then made available for visualization from a business, process, and security standpoint. Also, the Workspace ONE Intelligence service can perform automatic actions based on the rules defined in the Intelligence Console.
Dashboards
Dashboards present the historical or latest snapshot of information about the selected attributes, such as devices, users, operating systems, and applications. These dashboards are populated using widgets that are fully customizable, including, for example, layout tools, editing filters, and other options. Information can be displayed in the form of horizontal or vertical bar charts, donuts, and tables. You can also choose a specific date range to visualize historical data. All the widgets can be added as part of My Dashboard.
Following is a summary of some of the predefined widgets.
Table 9: Examples of Out-of-the-Box Dashboard Widgets
| Widget Category | Metrics |
| Devices | Number of enrolled devices, operating system breakdowns, compromised status |
| Apps | Most popular apps, agent installed (by version) |
| OS Updates | Top-ten KBs installed, devices with a CVSS risk score higher than 7 |
| User Logins | Trend of user logins, login failures (by authentication method) |
| App Launches | Top-five apps launched, according to both unique user count and total number of launches |
You can extend the filters and data points for the out-of-the-box widgets or create new widgets from scratch.
In addition to My Dashboard, Workspace ONE Intelligence includes three additional predefined dashboards (Security Risk, OS Updates, and Apps) allowing IT administrators to quickly gather insights into their environment and make data-driven decisions.
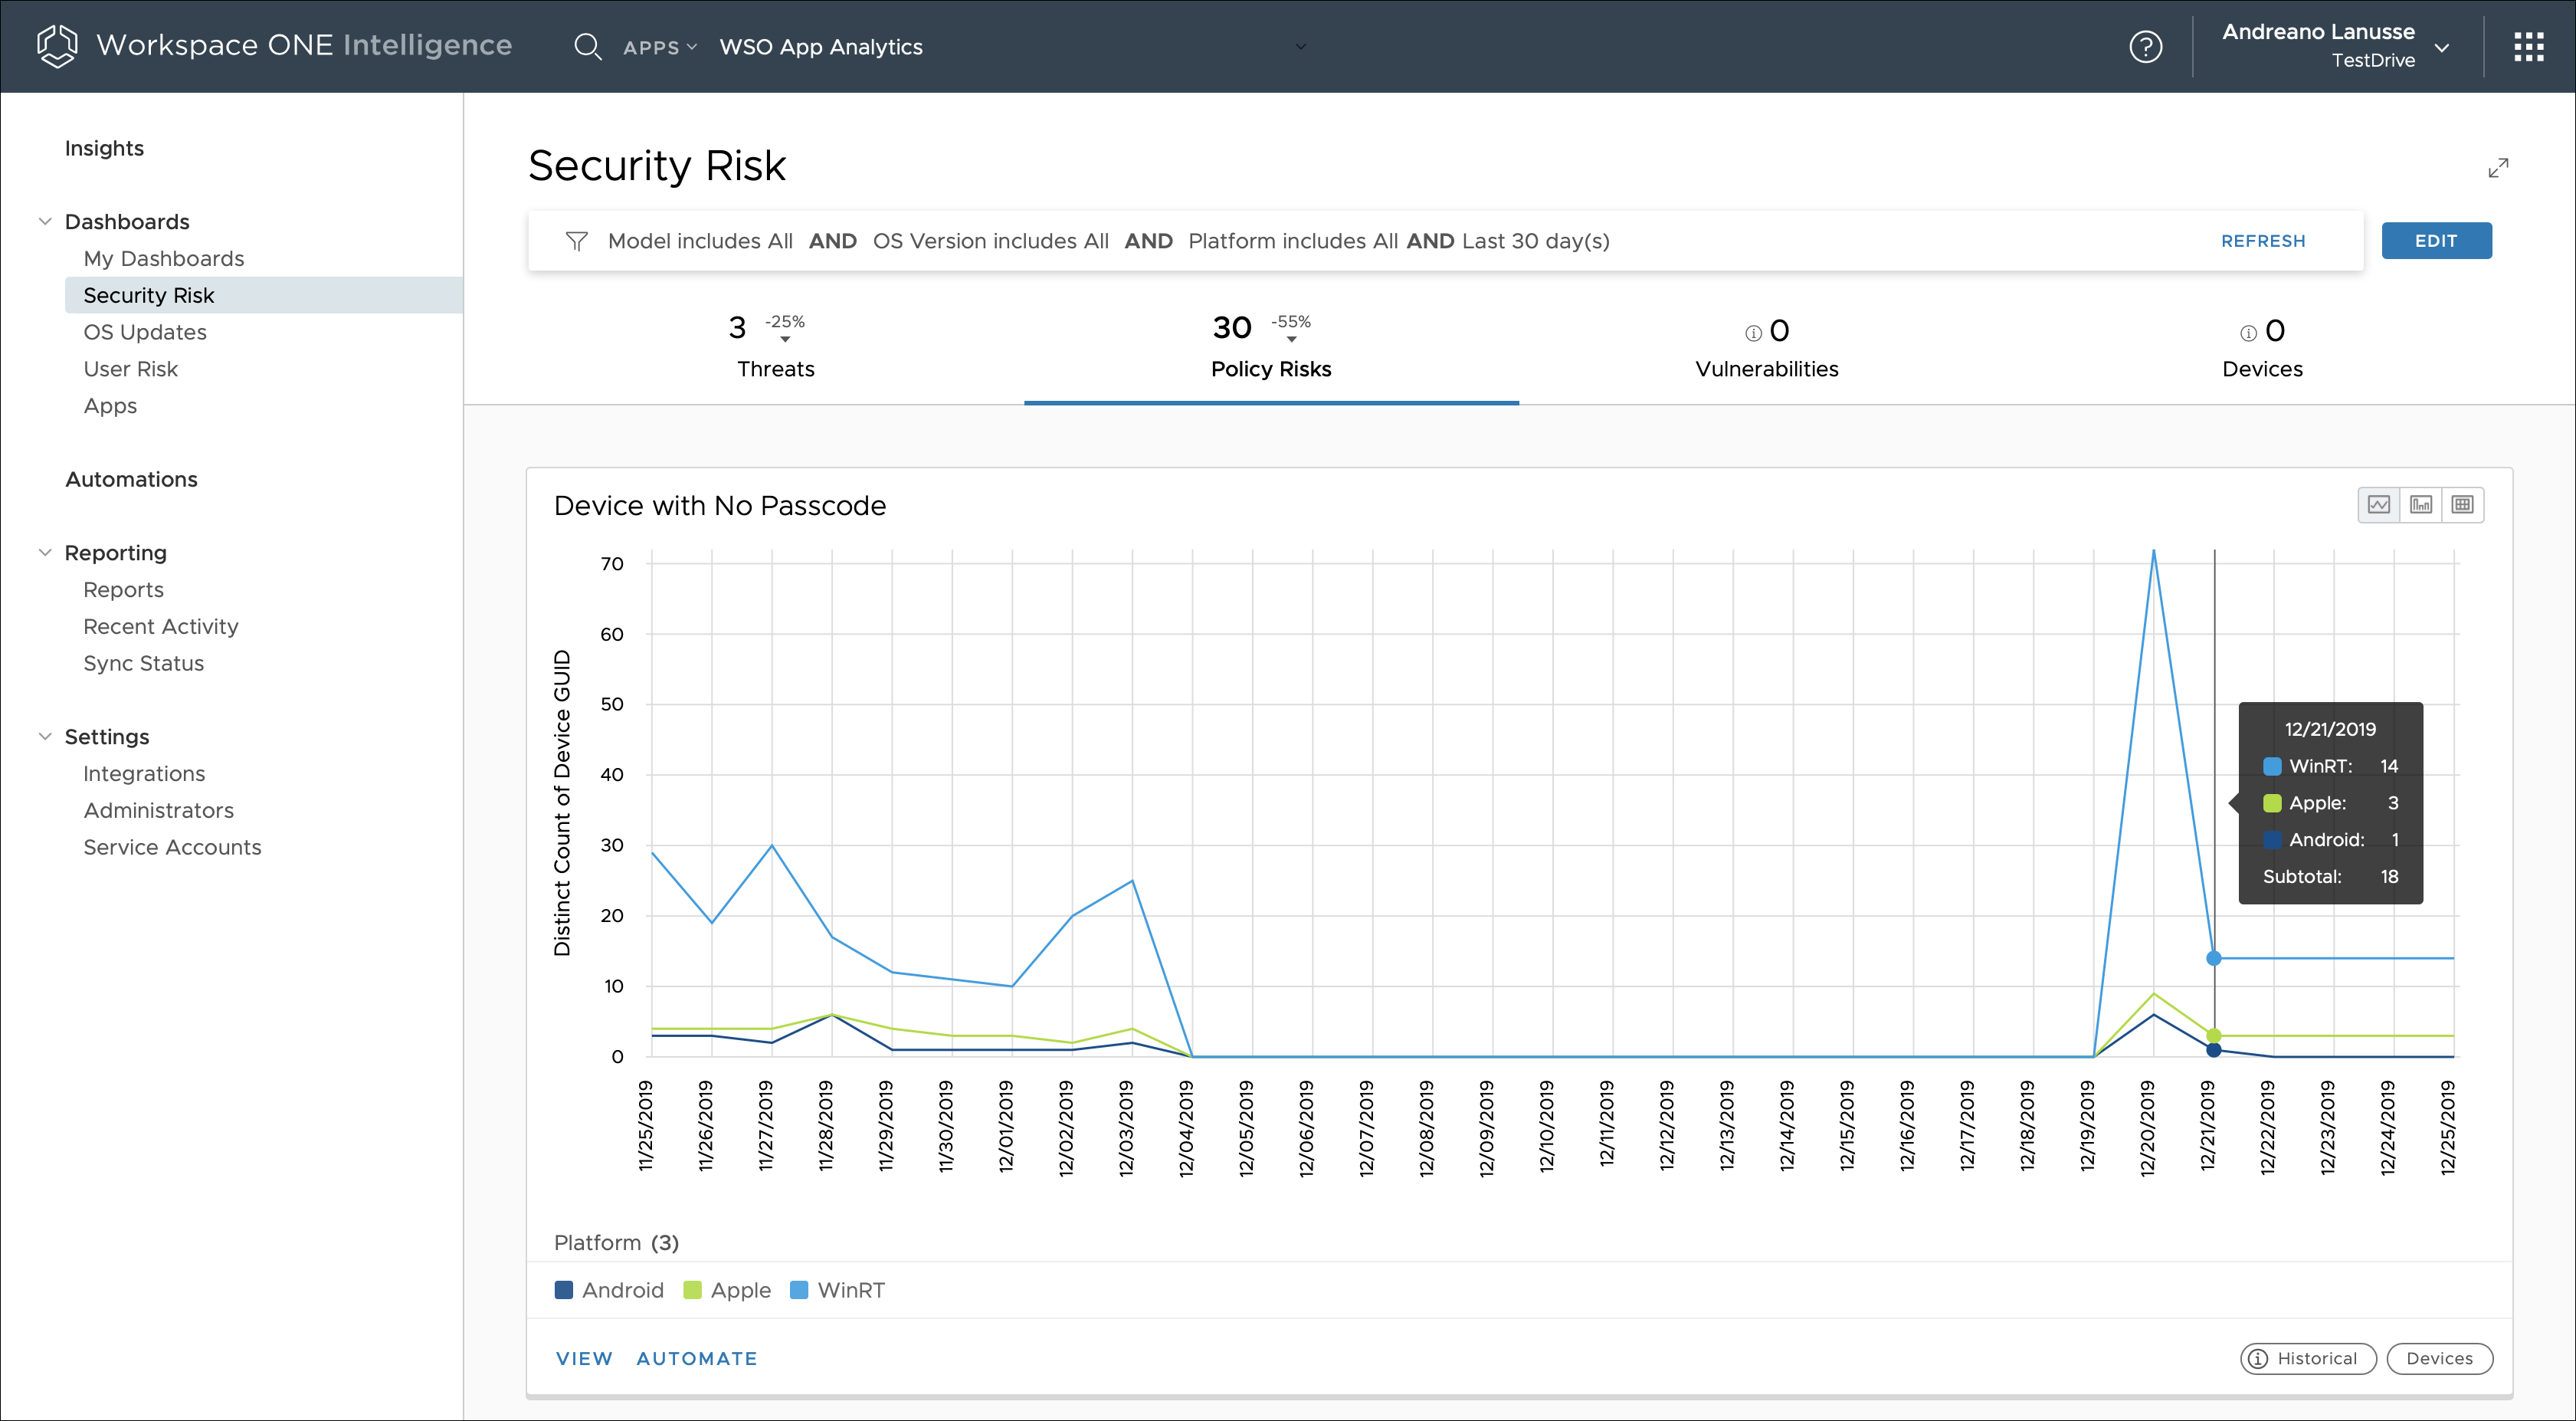
Figure 15: Device Passcode Risk Over Time, Displayed in the Security Risk Dashboard
Dashboards are available as a part of Workspace ONE Intelligence cloud offerings. No additional configuration is needed for this feature.
Reports
Reports are generated based on data fetched from Workspace ONE UEM, giving administrators real-time information about the deployment. The data is extracted from devices, applications, OS updates, and user data points.
Workspace ONE Intelligence offers a set of predefined templates. Additionally, you can customize these templates or create a new template from scratch to generate reports on the specific data points. Using the reports dashboard of Workspace ONE Intelligence, you can run, subscribe to, edit, copy, delete, and download (CSV format) reports.
Reports are available as a part of Workspace ONE Intelligence cloud offerings. No additional configuration is needed for this feature when you use cloud-based Workspace ONE UEM. For an on-premises deployment of Workspace ONE UEM, you must deploy the Workspace ONE Intelligence Connector. Reports are available only to groups whose organization group type is Customer.
Automation Capabilities
Automation in Workspace ONE Intelligence acts across categories that include devices, apps, and OS updates. Administrators can specify the conditions under which automatic actions will be performed. Automation removes the need for constant monitoring and manual processing to react to a security vulnerability. Configuring automation involves setting up the trigger, condition, and automated action, such as sending out a notification or installing or removing a certain profile or app.
Automation is facilitated by automation connectors. These connectors leverage Workspace ONE UEM REST APIs to communicate with Workspace ONE UEM and third-party services. The current list of automation connectors includes out-of-the-box Workspace ONE UEM, Service Now, and Slack. The REST APIs also extend the connector capabilities to any system that provides a REST API interface that can leverage the Workspace ONE Intelligence Custom Connectors.
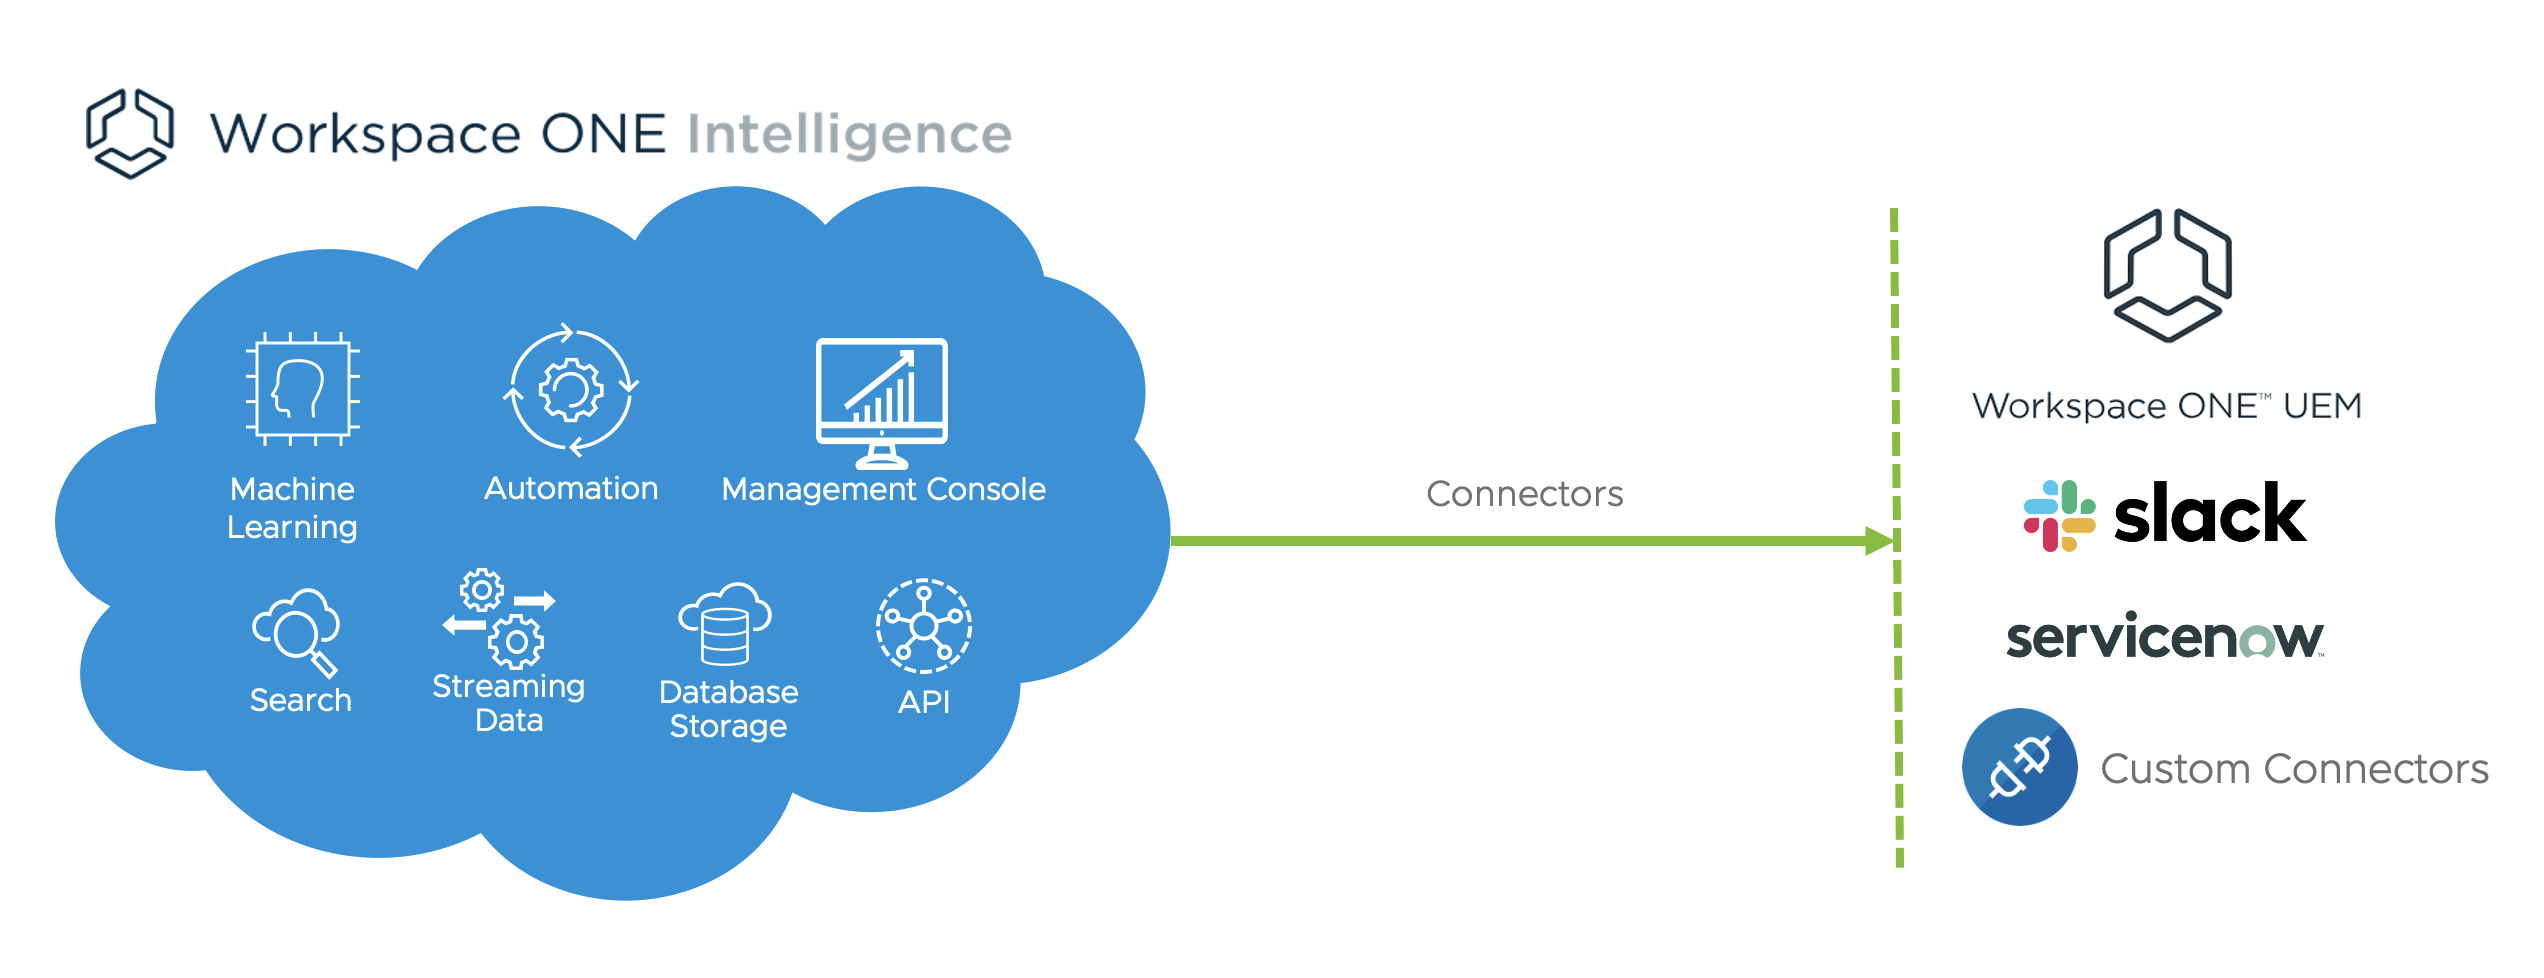
Figure 16: Workspace ONE Intelligence Connectors
To learn more about how to integrate Workspace ONE Intelligence Connector with Workspace ONE UEM and third-part services, see Automation Connections, API Communications, and Third-Party Connections.
Getting Started
Workspace ONE Intelligence is offered as a 30-day free trial or can be purchased as an add-on and included with the Workspace ONE Enterprise bundle. The first time you log in to the Workspace ONE Intelligence dashboard, you must opt-in to Workspace ONE Intelligence by selecting a check box.
For more information, see the VMware Workspace ONE Intelligence guide.
Summary and Additional Resources
Now that you have come to the end of this design chapter on Workspace ONE Intelligence, you can return to the landing page and use the tabs, search, or scroll to select your next chapter in one of the following sections:
- Overview chapters provide understanding of business drivers, use cases, and service definitions.
- Architecture chapters give design guidance on the products you are interested in including in your platform, including Workspace ONE UEM, Workspace ONE Access, Workspace ONE Assist, Workspace ONE Intelligence, Horizon Cloud Service, Horizon, App Volumes, Dynamic Environment Manager, and Unified Access Gateway.
- Integration chapters cover the integration of products, components, and services you need to create the platform capable of delivering the services that you want to deliver to your users.
- Configuration chapters provide reference for specific tasks as you build your platform, such as installation, deployment, and configuration processes for Workspace ONE, Horizon Cloud Service, Horizon, App Volumes, Dynamic Environment Management, and more.
Additional Resources
For more information about VMware Workspace ONE Intelligence, you can explore the following resources:
Changelog
The following updates were made to this guide:
| Date | Description of Changes |
| 2023-07-24 |
|
| 2020-07-01 |
|
| 2020-02-27 |
|
Author and Contributors
This chapter was written by:
- Andreano Lanusse, Staff End-User-Computing (EUC) Architect in End-User-Computing Technical Marketing, VMware.
Feedback
Your feedback is valuable.
To comment on this paper, contact VMware End-User-Computing Technical Marketing at euc_tech_content_feedback@vmware.com.