
Troubleshooting OpenSearch Cluster Health
Introduction
OpenSearch is an open source search and analytics solution used within Workspace ONE Access. Although OpenSearch is a third-party product, on-premises Workspace ONE Access administrators can benefit from a generic OpenSearch troubleshooting guide.
You can search the Internet for more tips and tricks on how to troubleshoot your Workspace ONE Access and OpenSearch environment. OpenSearch is a fork of the previously used Elasticsearch used in Access and vIDM versions prior. Access migrated from Elasticsearch to OpenSearch 1.x with version 22.x and to version 2.x with the 23.x release.
Audience
This guide is intended for experienced IT administrators of existing environments. Knowledge of Workspace ONE Access and OpenSearch/Elasticsearch is assumed.
Troubleshooting OpenSearch Cluster Health
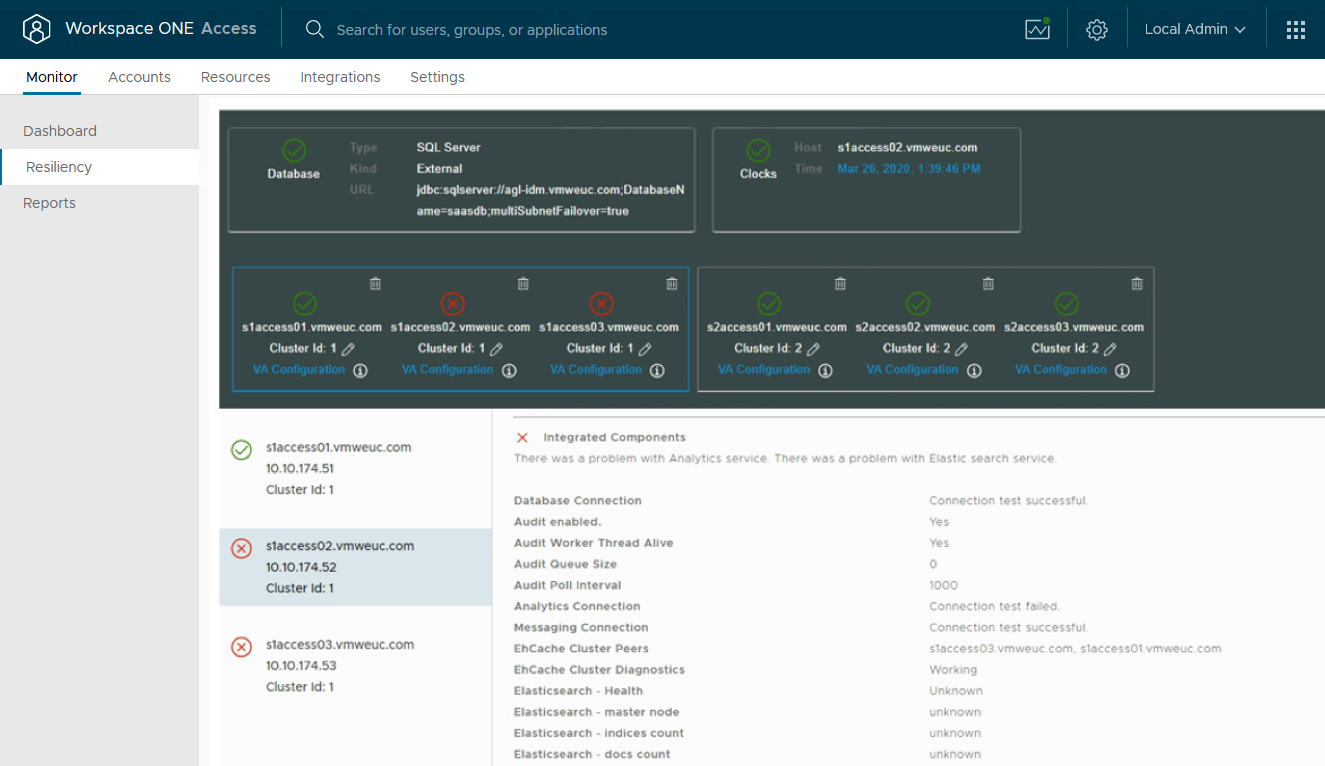
Most issues with OpenSearch and Workspace ONE Access arise when you create a cluster. It is common to see the following errors in the System Diagnostic/Resiliency page:
First test some common issues affecting OpenSearch health around disk usage and RabbitMQ.
Filesystem health
Due to the default policy of never deleting old data, the /db filesystem usage will continue to grow until it runs out of space, so its important to monitor how much free space there is on the /db filesystem before it gets too full. Elasticsearch will stop writing documents when it get 85% full (set via the cluster.routing.allocation.disk.watermark.low setting) and RabbitMQ will stop working when it gets down to just 250MB free (set via the disk_free_limit setting). Details on how to determine the growth rate per day and how to change that policy is in the troubleshooting section.
Check the free disk space for the /db filesystem with the command:
df -h
The rough calculation of the per-day growth rate described in the "Avoid disk space issues" section will let you determine how many days before you run out of space and need to either add space or adjust the data retention policy.
RabbitMQ Queues
A very early indicator that something is wrong is if the size of pending documents in the analytics queue is growing. We use RabbitMQ for other types of messages, which go in their own queues, but the analytics queue is the only one that does not have a TTL, so is the only one that can grow. This is so its messages never get deleted and the audit records never get lost. Typically the analytics queue should have just 1 or 2 messages waiting to be processed, unless something is wrong or there is a temporary spike in records being generated (eg, during a large directory sync the queue might temporarily grow if the system cannot keep up). The queue size should be checked on each node with the command:
rabbitmqctl list_queues | grep analytics
If the number reported is larger than 100, its time to investigate why - see the "RabbitMQ analytics queue is large" section. This is also reported as the "AuditQueueSize" value in the health API: /SAAS/API/1.0/REST/system/health/
OpenSearch Health
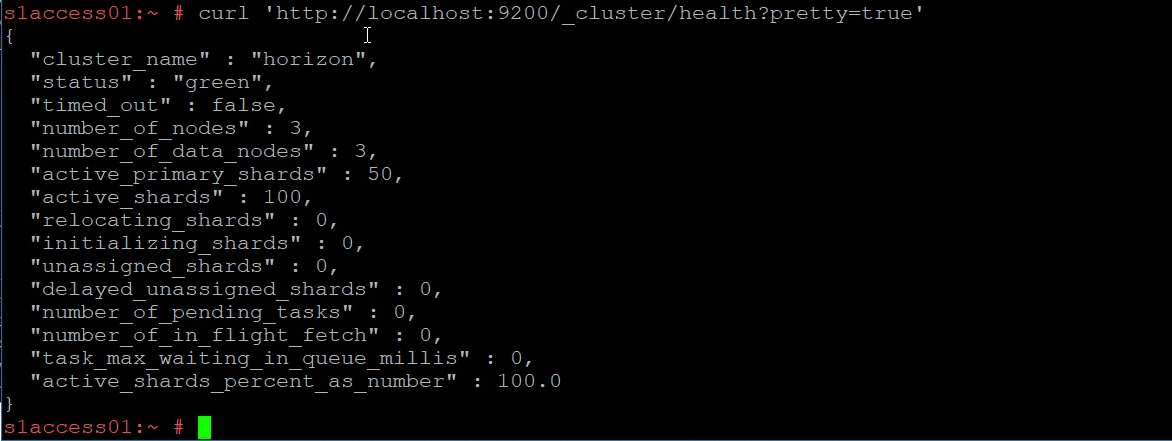
Connect to the console (either via vSphere remote console or SSH) of your Workspace ONE Access virtual appliances. After you log in as ROOT, run the following command to verify the cluster health:
curl 'http://localhost:9200/_cluster/health?pretty=true'
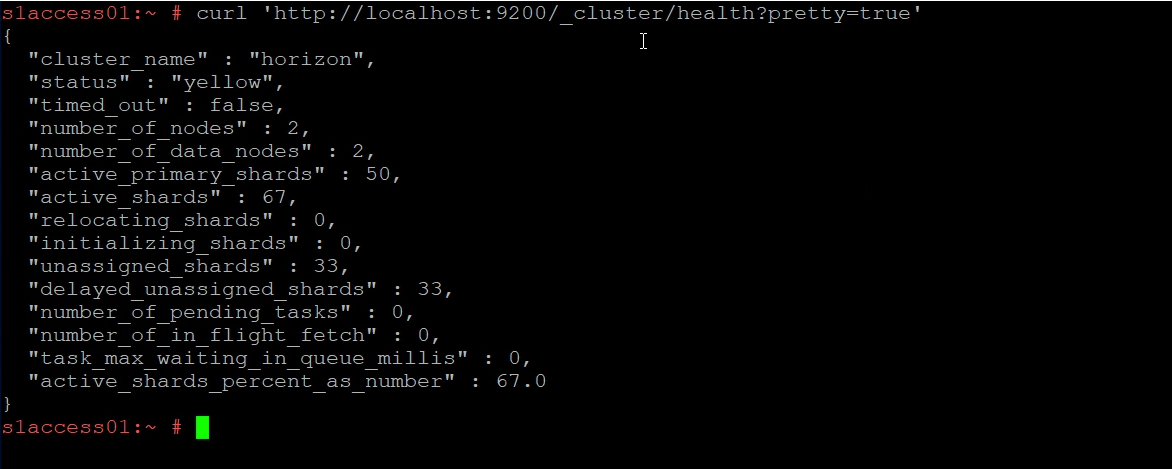
The status is usually either yellow or red. (If you have a single Workspace ONE Access node, the cluster health is always yellow because there is no cluster).
The different status indicators.
| green | everything is good, there are enough nodes in the cluster to ensure at least 2 full copies of the data spread across the cluster. |
| yellow | functioning, but there are not enough nodes in the cluster to ensure HA (eg, a single node cluster will always be in the yellow state because it can never have 2 copies of the data). |
| red | broken, unable to query existing data or store new data, typically due to not enough nodes in the cluster to function or out of disk space. |
You can also see how many unassigned shards your cluster has.
Next, verify that all three nodes report the same primary cluster. Run the following command on each of the nodes:
curl http://localhost:9200/_cluster/state/master_node,nodes?pretty
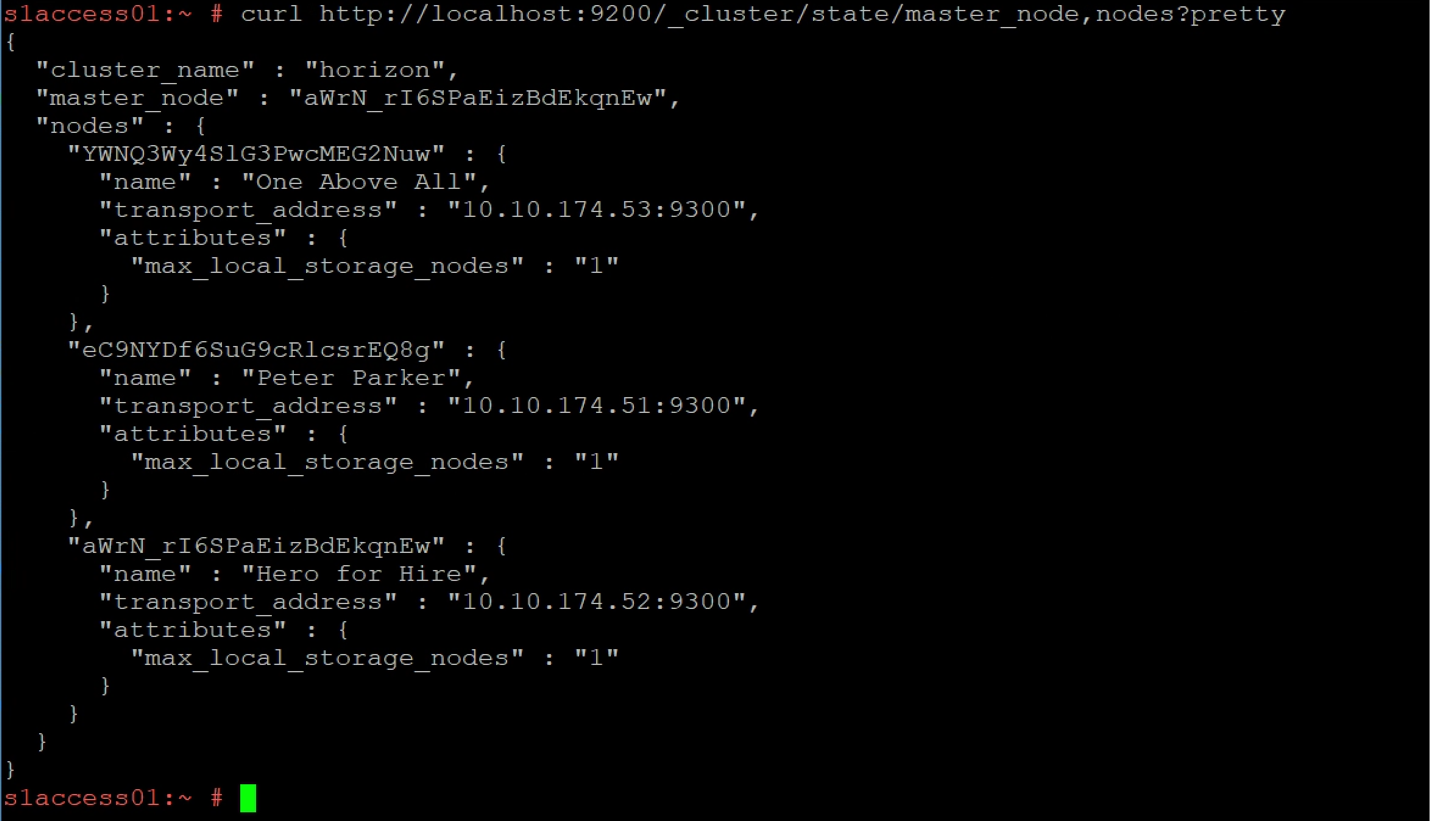
Compare the output between all three nodes. A common reason for a yellow or red status on the OpenSearch cluster is that all nodes do not share a common view of the cluster.
You might see that one node does not list the same node as the primary and it might not even list the other nodes. This node is most likely the culprit of a yellow state.
Most of the time, a simple restart of the OpenSearch service is enough to bring the node back into the cluster. But also do the previous mentioned checks on disk space and free up or add disk space if required.
On the node at fault, run the following commands, first checking the status of the service:
service opensearch status
Then stop the opensearch service:
service opensearch stop
Wait a few minutes and then run:
service opensearch start
Give OpenSearch time to start and verify that all nodes now report the same primary cluster and that the primary cluster lists all nodes:
curl http://localhost:9200/_cluster/state/master_node,nodes?pretty
Next, check the cluster health again:
curl 'http://localhost:9200/_cluster/health?pretty=true'
For red status it can be the same issue as above or a master node misbehaving and not accepting connections from the other nodes. Determine the master node and restart the service on that node. One of the other two nodes should immediately become the master (re-run the curl on the other nodes again to verify) and the old master will re-join the cluster as a regular node when it comes up.
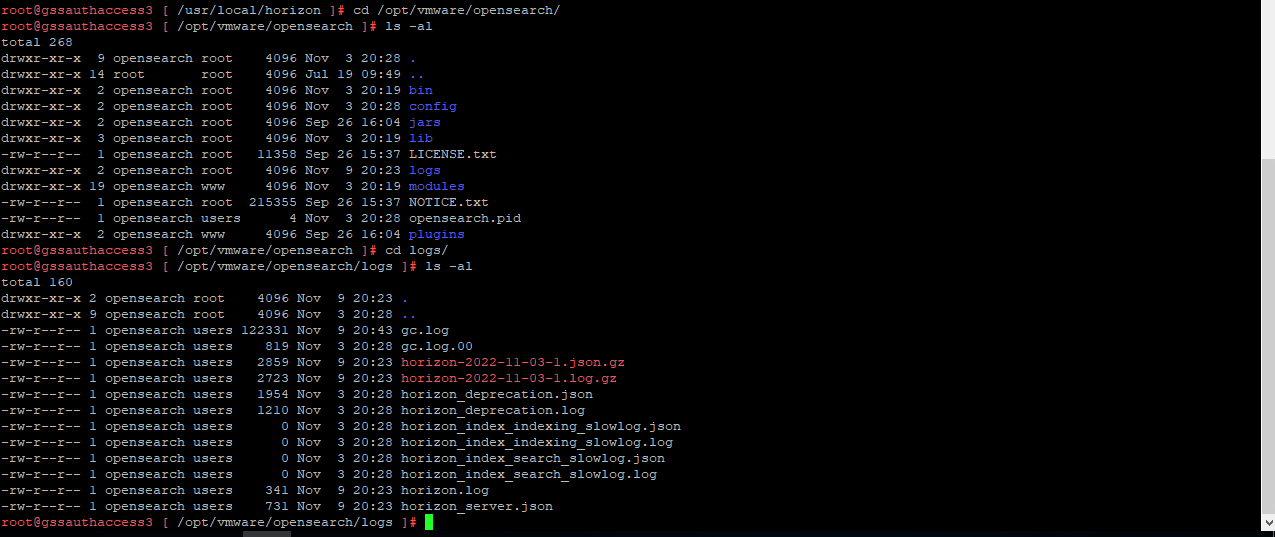
If you need to check the logs further be aware of the changes to the configuration and log locations after the switch from Elasticsearch to OpenSearch:
| Configuration | Elasticsearch | Opensearch |
| Log location | path.logs: /opt/vmware/elasticsearch/logs | path.logs: /opt/vmware/opensearch/logs |
| Data location | path.data: /db/elasticsearch/horizon | path.data: /db/opensearch/horizon |
![]()
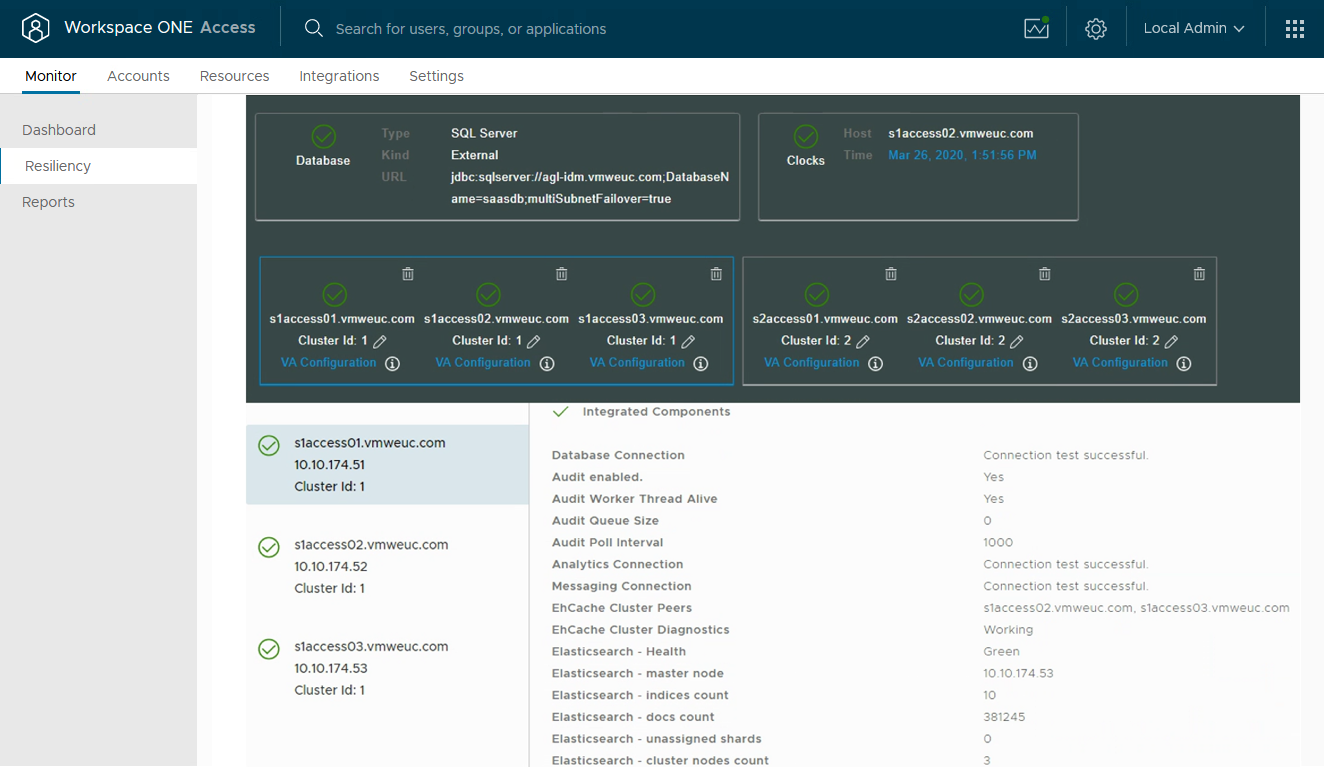
After you have completed the previous steps, you should have a system that reports each status as green and has no unassigned shards.
Finally, each component on your systems diagnostic page reports a successful green status.
In any case, if you still have unassigned shards, this must be fixed. DO NOT DELETE UNASSIGNED SHARDS. You need to address the underlying cause, then the unassigned shards will be resolved by the cluster on its own. It is extremely rare for unassigned shards to be a real issue needing direct action. Here is an excellent article on the causes of unassigned shards and how to diagnose the cause: https://www.datadoghq.com/blog/elasticsearch-unassigned-shards/
Summary and Additional Resources
This guide provided basic steps to troubleshoot OpenSearch cluster health in your Workspace ONE Access environment.
For more information, see the Workspace ONE Access product page.
Changelog
The following updates were made to this guide.
| Date | Description of Changes |
| 2024/01/17 | • Updated with OpenSearch details. |
| 2020/04/14 | • Guide was published. |
About the Author
This guide was written by:
- Sascha Warno, Staff Architect, EUC Division Broadcom
The original version was written by Peter Bjork, Principal Architect, EUC Division Broadcom.
Feedback
To comment on this paper, contact End-User-Computing Technical Marketing at euc_tech_content_feedback@vmware.com.