
The New Workspace ONE Add-In for Excel
A tool to enhance your reporting and troubleshooting
When working with Enterprise SaaS applications like Workspace ONE, extracting information from APIs is not the easiest proposition. If you aren’t a programmer, learning the prerequisite skills is an obstacle many do not have time for when they are busy enrolling devices and helping their users.
That’s where the Workspace ONE Add-In for Excel comes in. It gives you the ability to connect to your UEM environment and the related Workspace ONE Intelligence environment, and to pull your data into Excel. You can then manipulate the data into reports and help troubleshoot issues.
This quick overview video will help you understand the basics:
On the Workspace ONE Add-In home page, you will find installation instructions for the Add-in, as well as the caching server that you install to make your experience snappy. You can install the caching server on your laptop if you are a single admin and meet the requirements. If you have a team, or just like to keep things in their own areas, you can install it on its own server.
Once deployed, you can get up-to-the-minute information about your devices, apps, profiles, and baselines. In addition, you can connect to your Workspace ONE Intelligence environment, grab your latest reports, and then drill into them to divine even more insights using the tools built into Excel like PivotTables and the amazing graphing functionality.
For a practical example, I’ll give you one use case that many administrators like to keep track of: license usage.
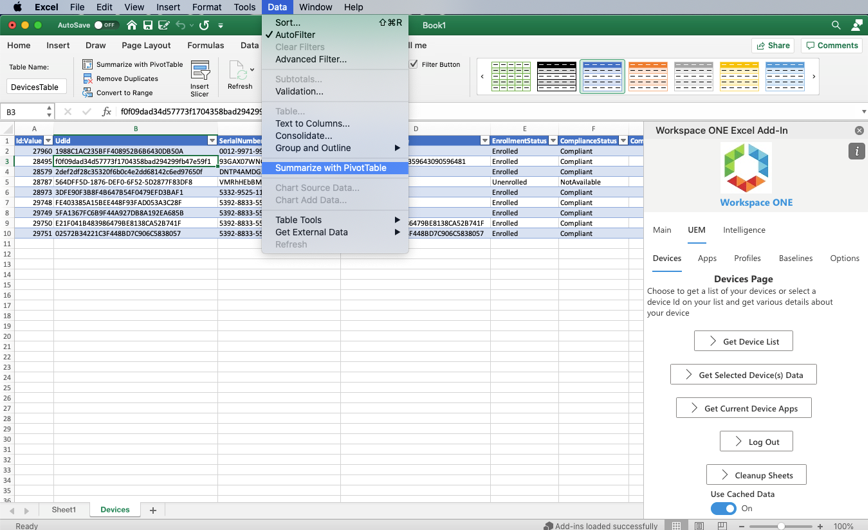
- Once you have your device list in Excel, you can select any field in your table (this example is DevicesTable), open the Data menu, and select Summarize with PivotTable.

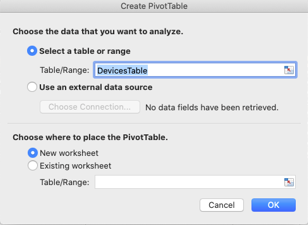
- Under Choose to place the PivotTable, select New worksheet, and click OK.
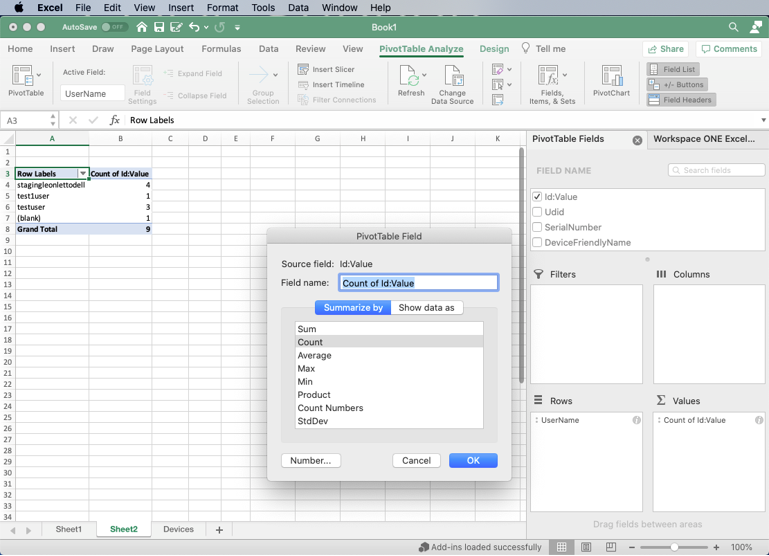
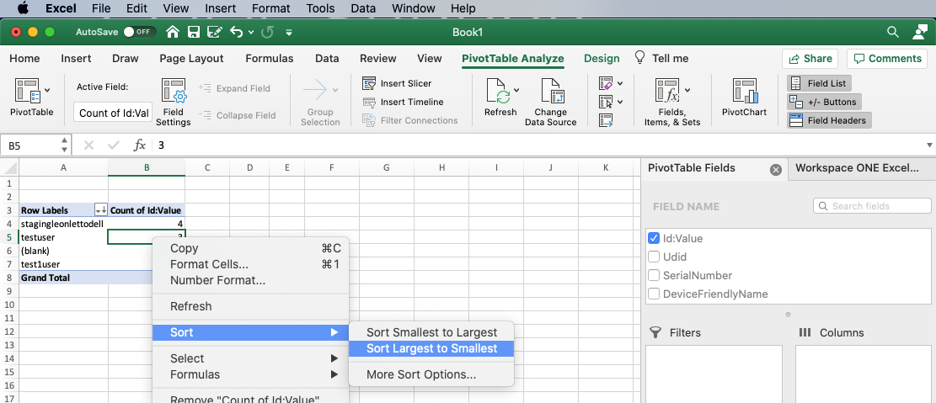
- In your new worksheet, in the PivotTable Fields area on the right, click-and-drag UserName down to the Rows box, and ID:Value to the Values box. Then click the “i” next to Sum of ID:Value, and under Summarize by, select Count, and then click OK.
- This gives you a report showing the number of devices your users have enrolled. To get your report in descending order, right-click any value in the Count of ID:Value column and select Sort > Sort Largest to Smallest.
This is just one example of information you can easily glean, once you have your data in Excel.
For a hands-free listen, tune in to https://techzone.vmware.com/podcast?share=podcast2930.
I am sure you will find many use cases that I have not thought of; I look forward to hearing about your results and receiving your feature requests.